Feature goal: To provide administrators with a clear, user-friendly dashboard containing key sales metrics for analyzing business performance and making data-driven decisions.
🎉 Price from: $297.5 ($350)
You save: $52.5 (15%)
Rates: Junior $8–$12/h | Middle $20–$25/h | Senior $30–$40/h
Timeline: 4-6 days
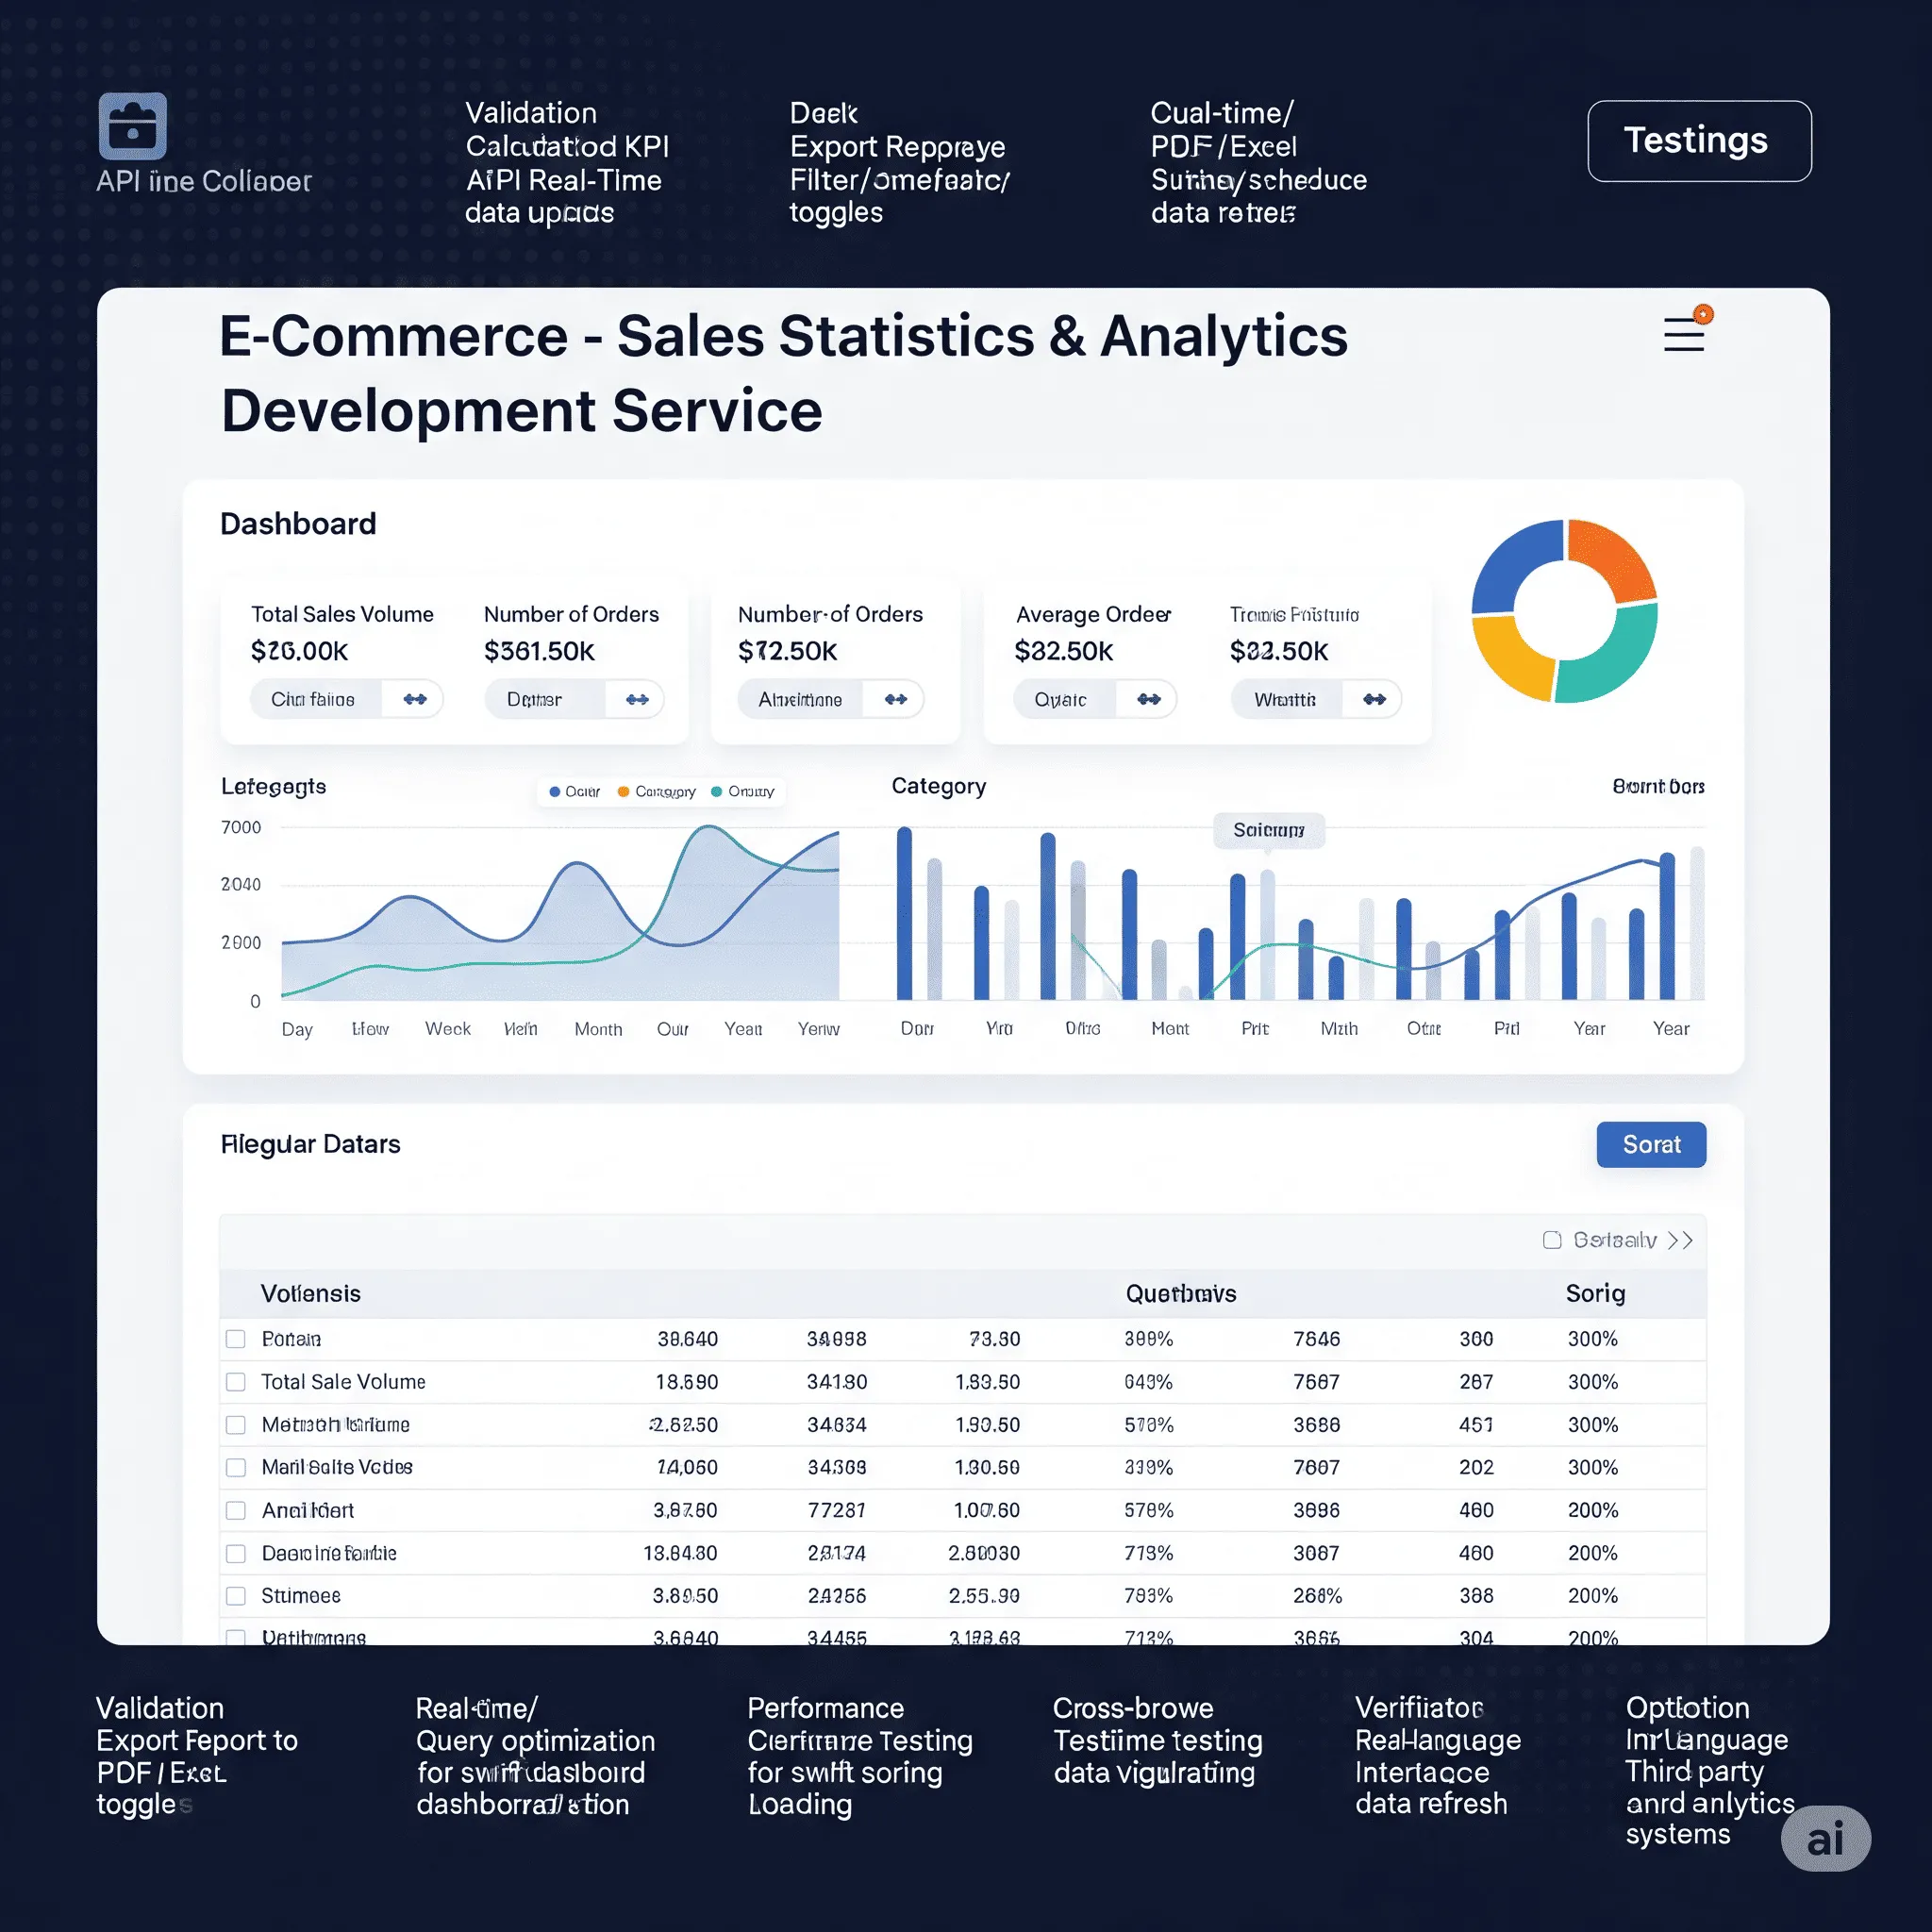
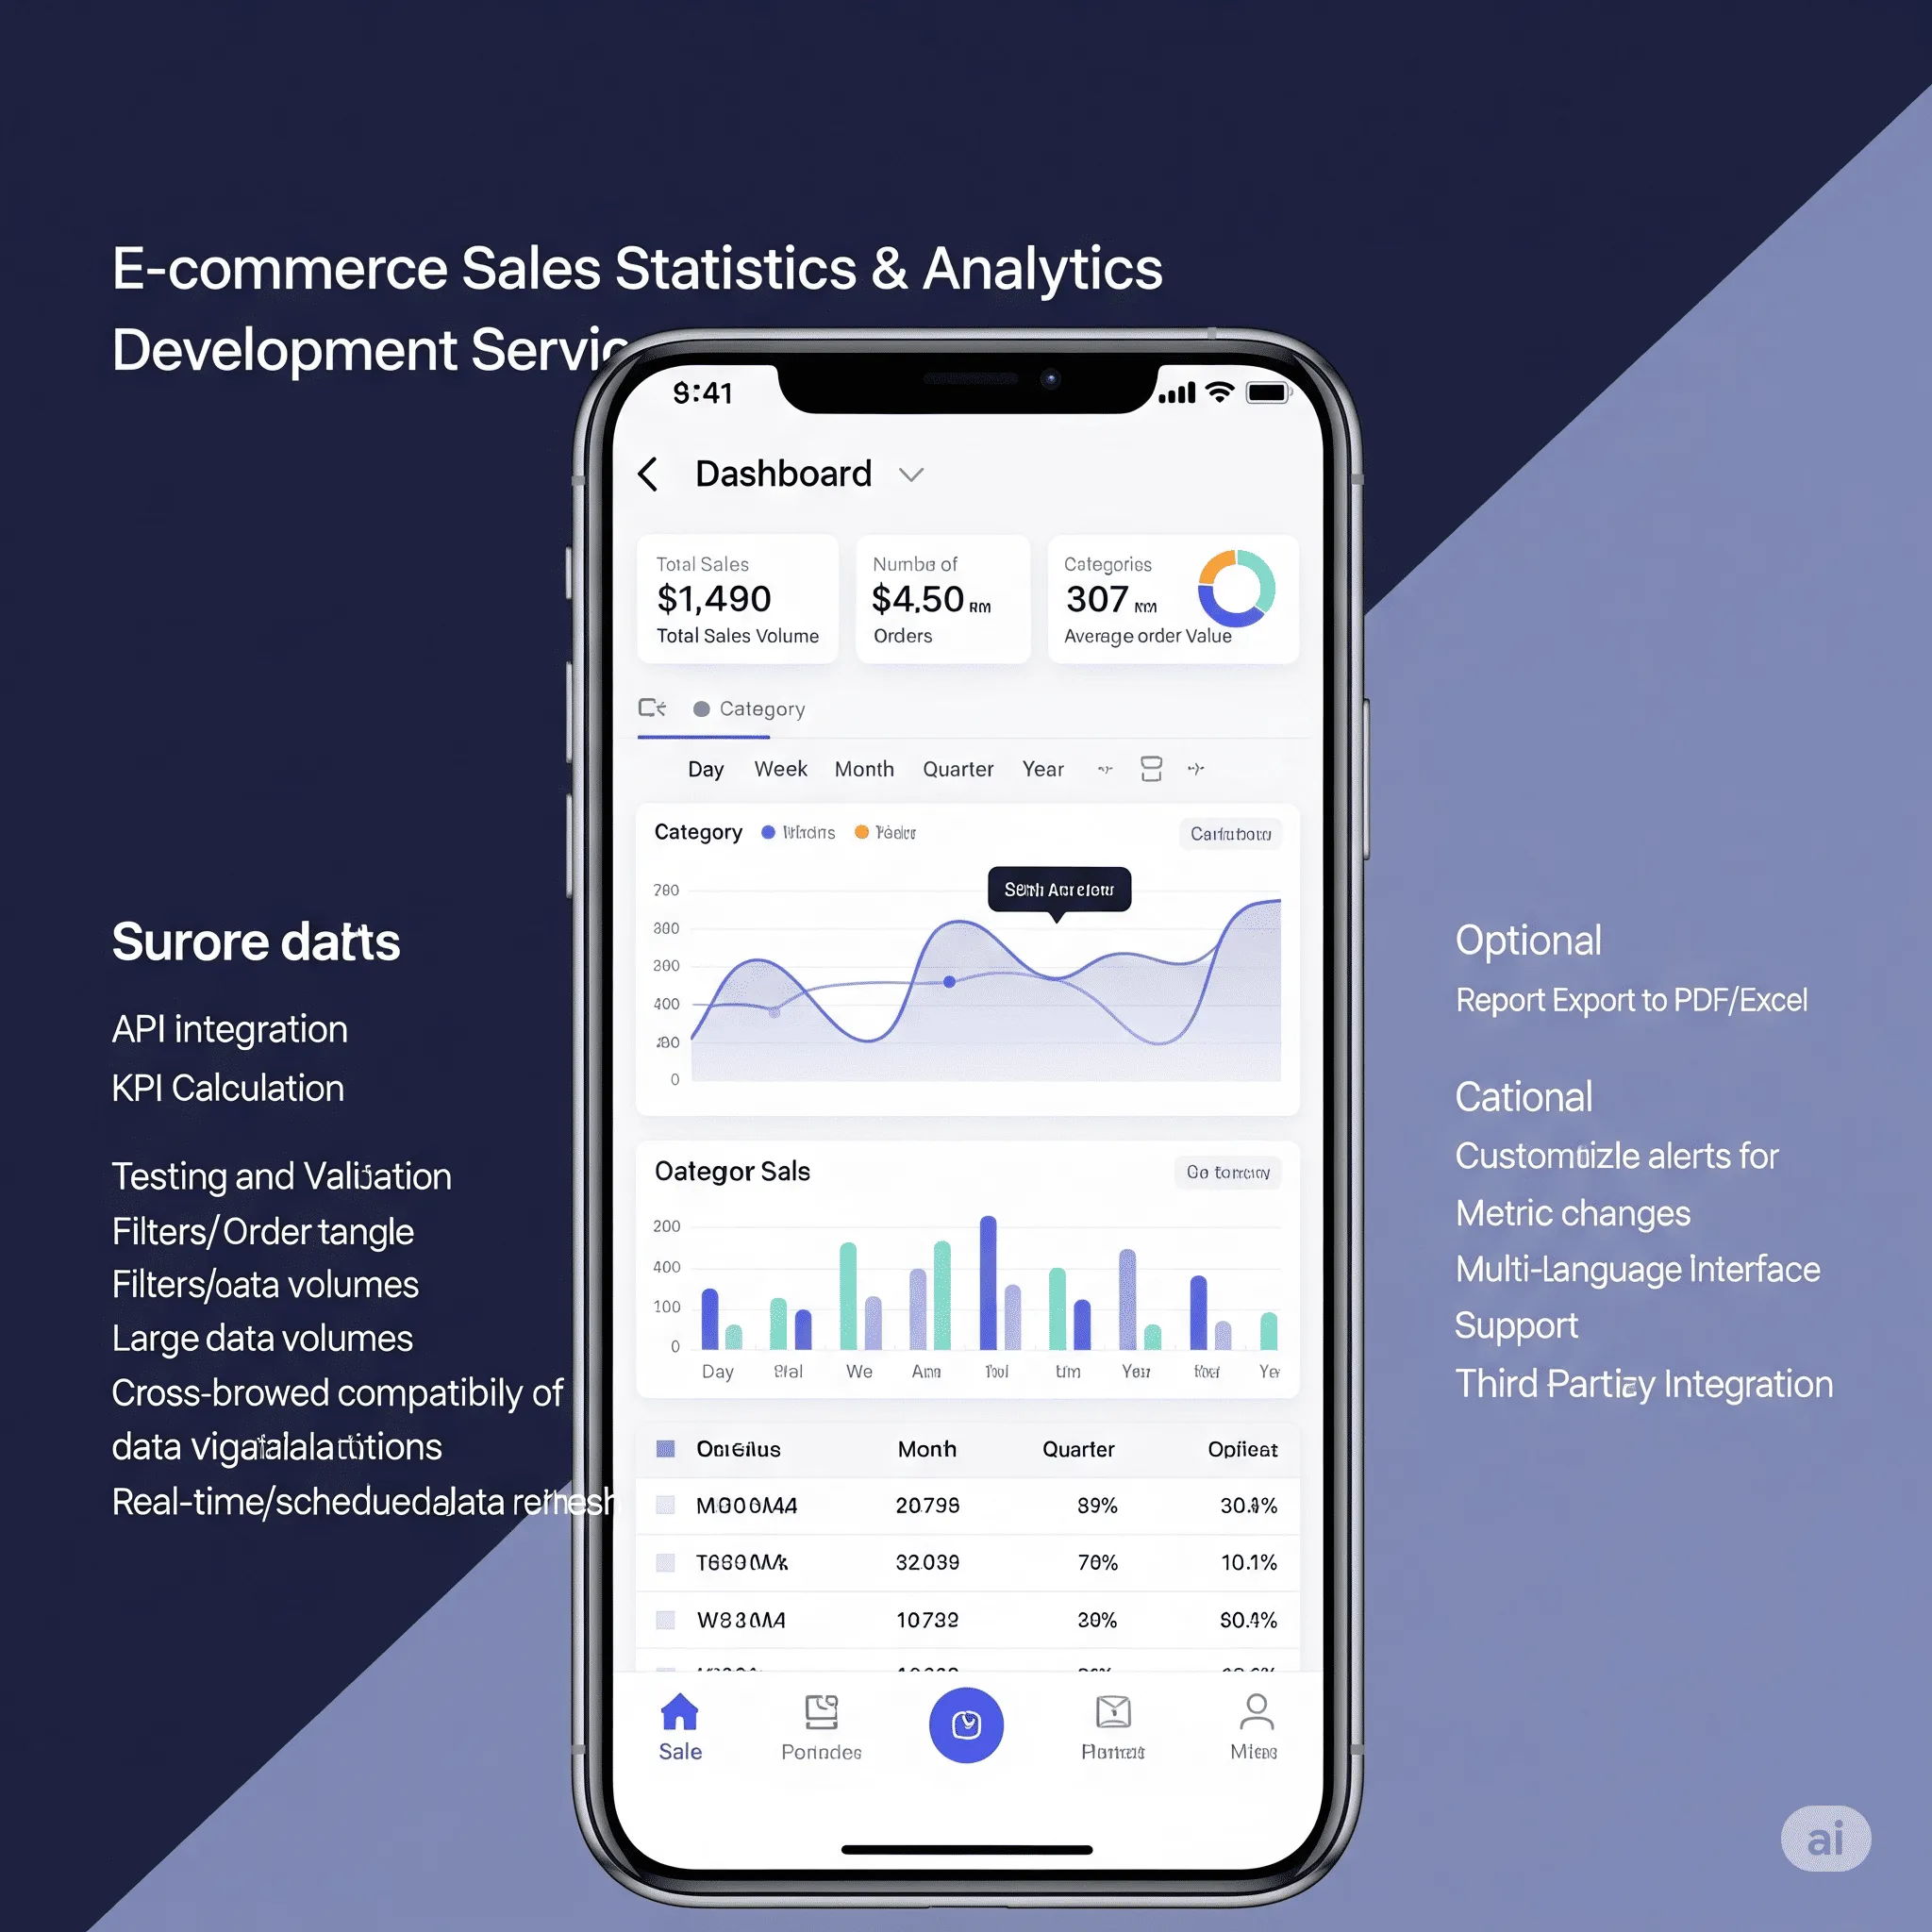
You choose the Sales Analytics module, register, and specify the data sources and key metrics you want to monitor. A developer then builds an interactive dashboard with real-time or near-real-time updates and custom filters.
Certified freelancers (Junior, Middle, or Senior levels) handle the development. You select the expertise level that fits your timeline and budget.
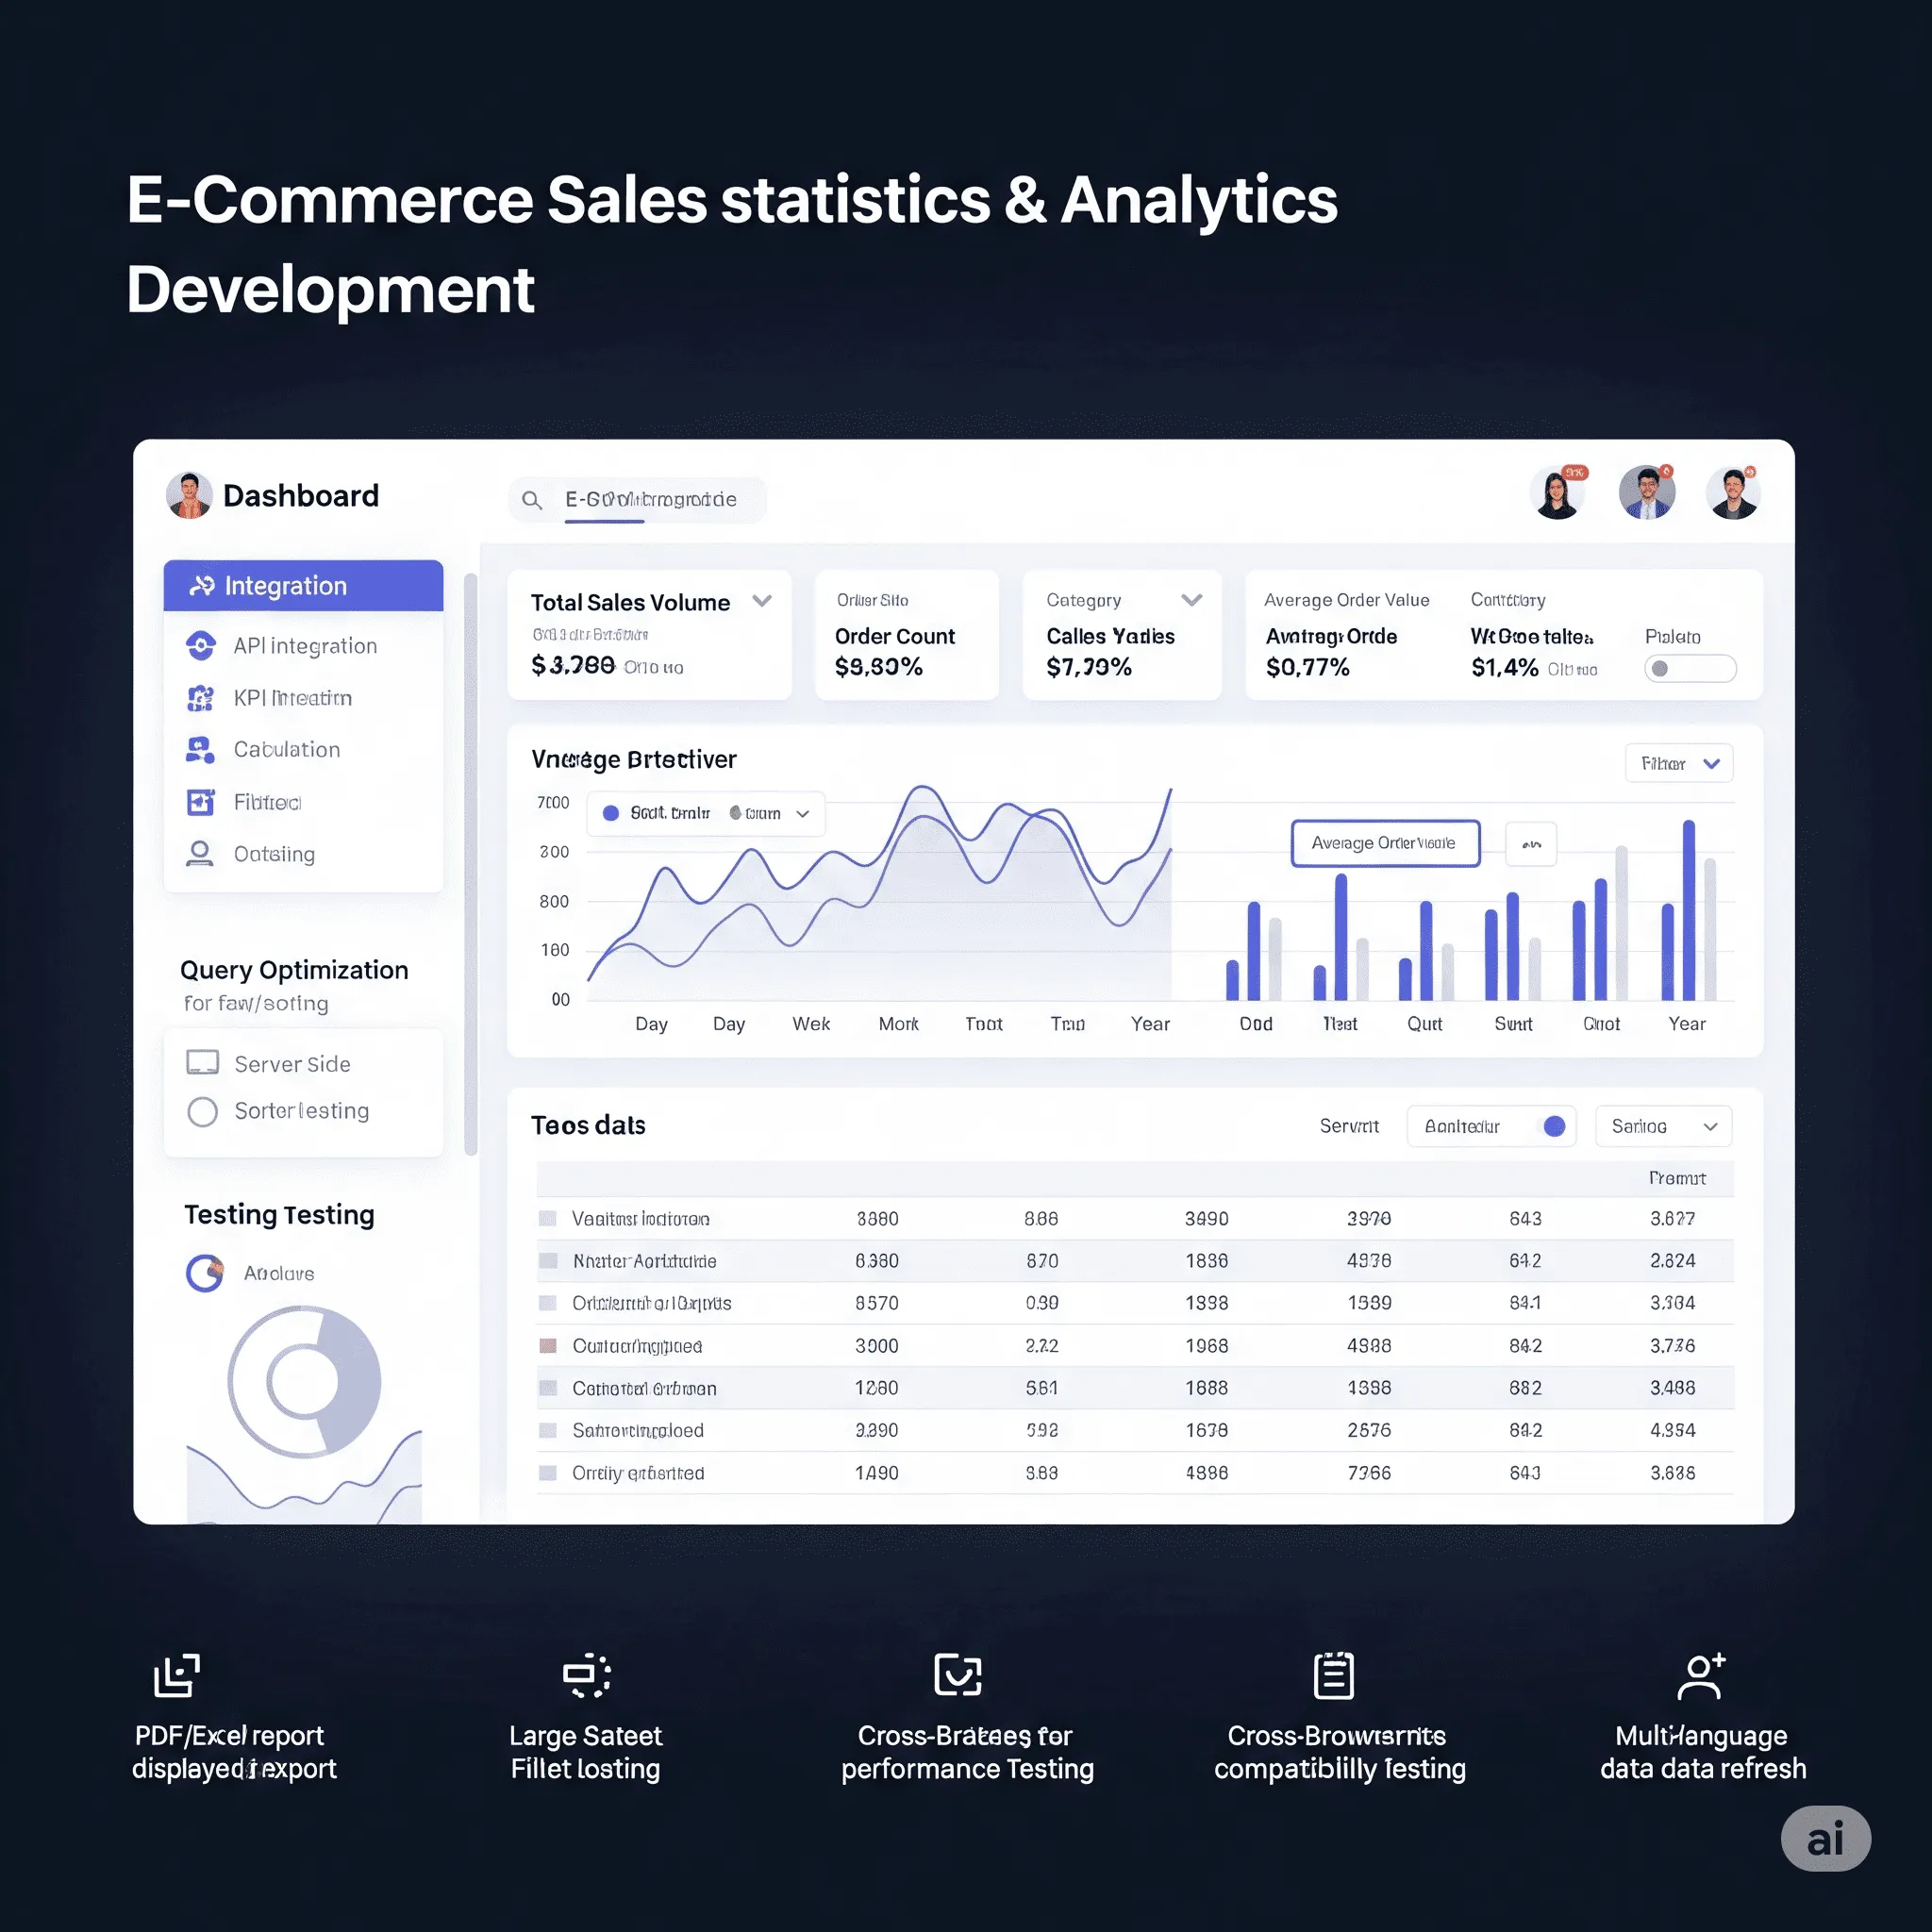
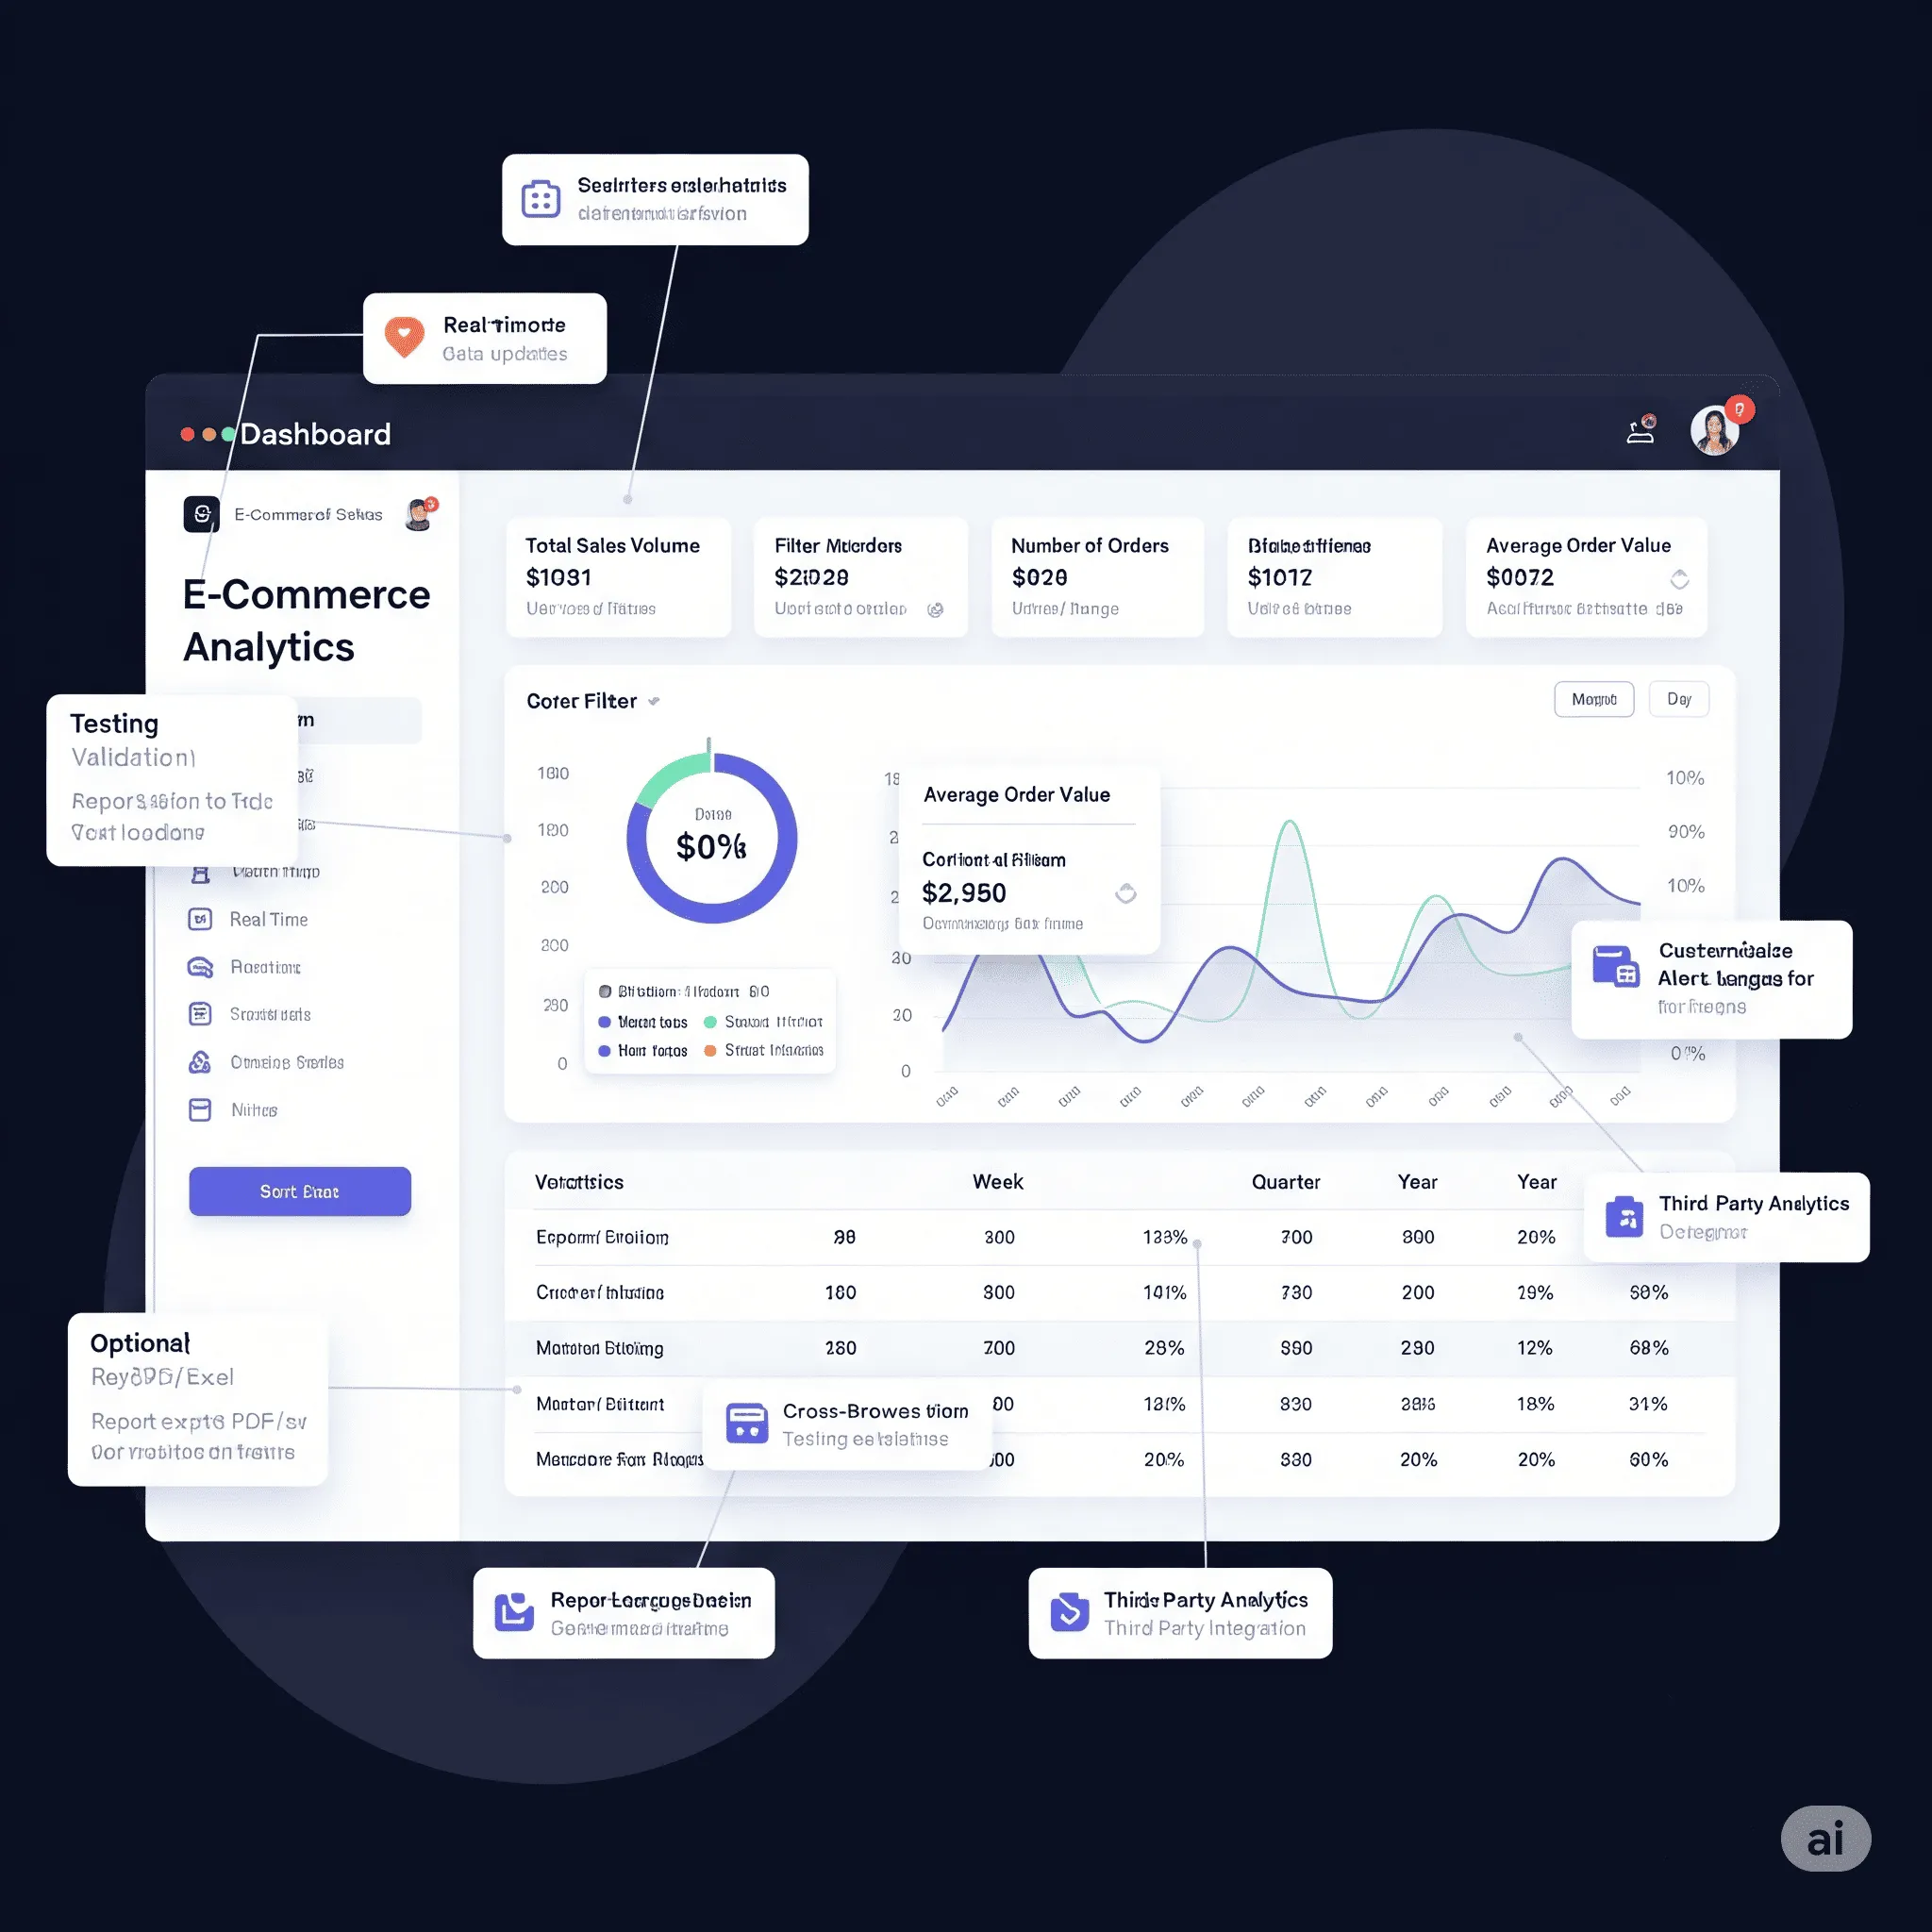
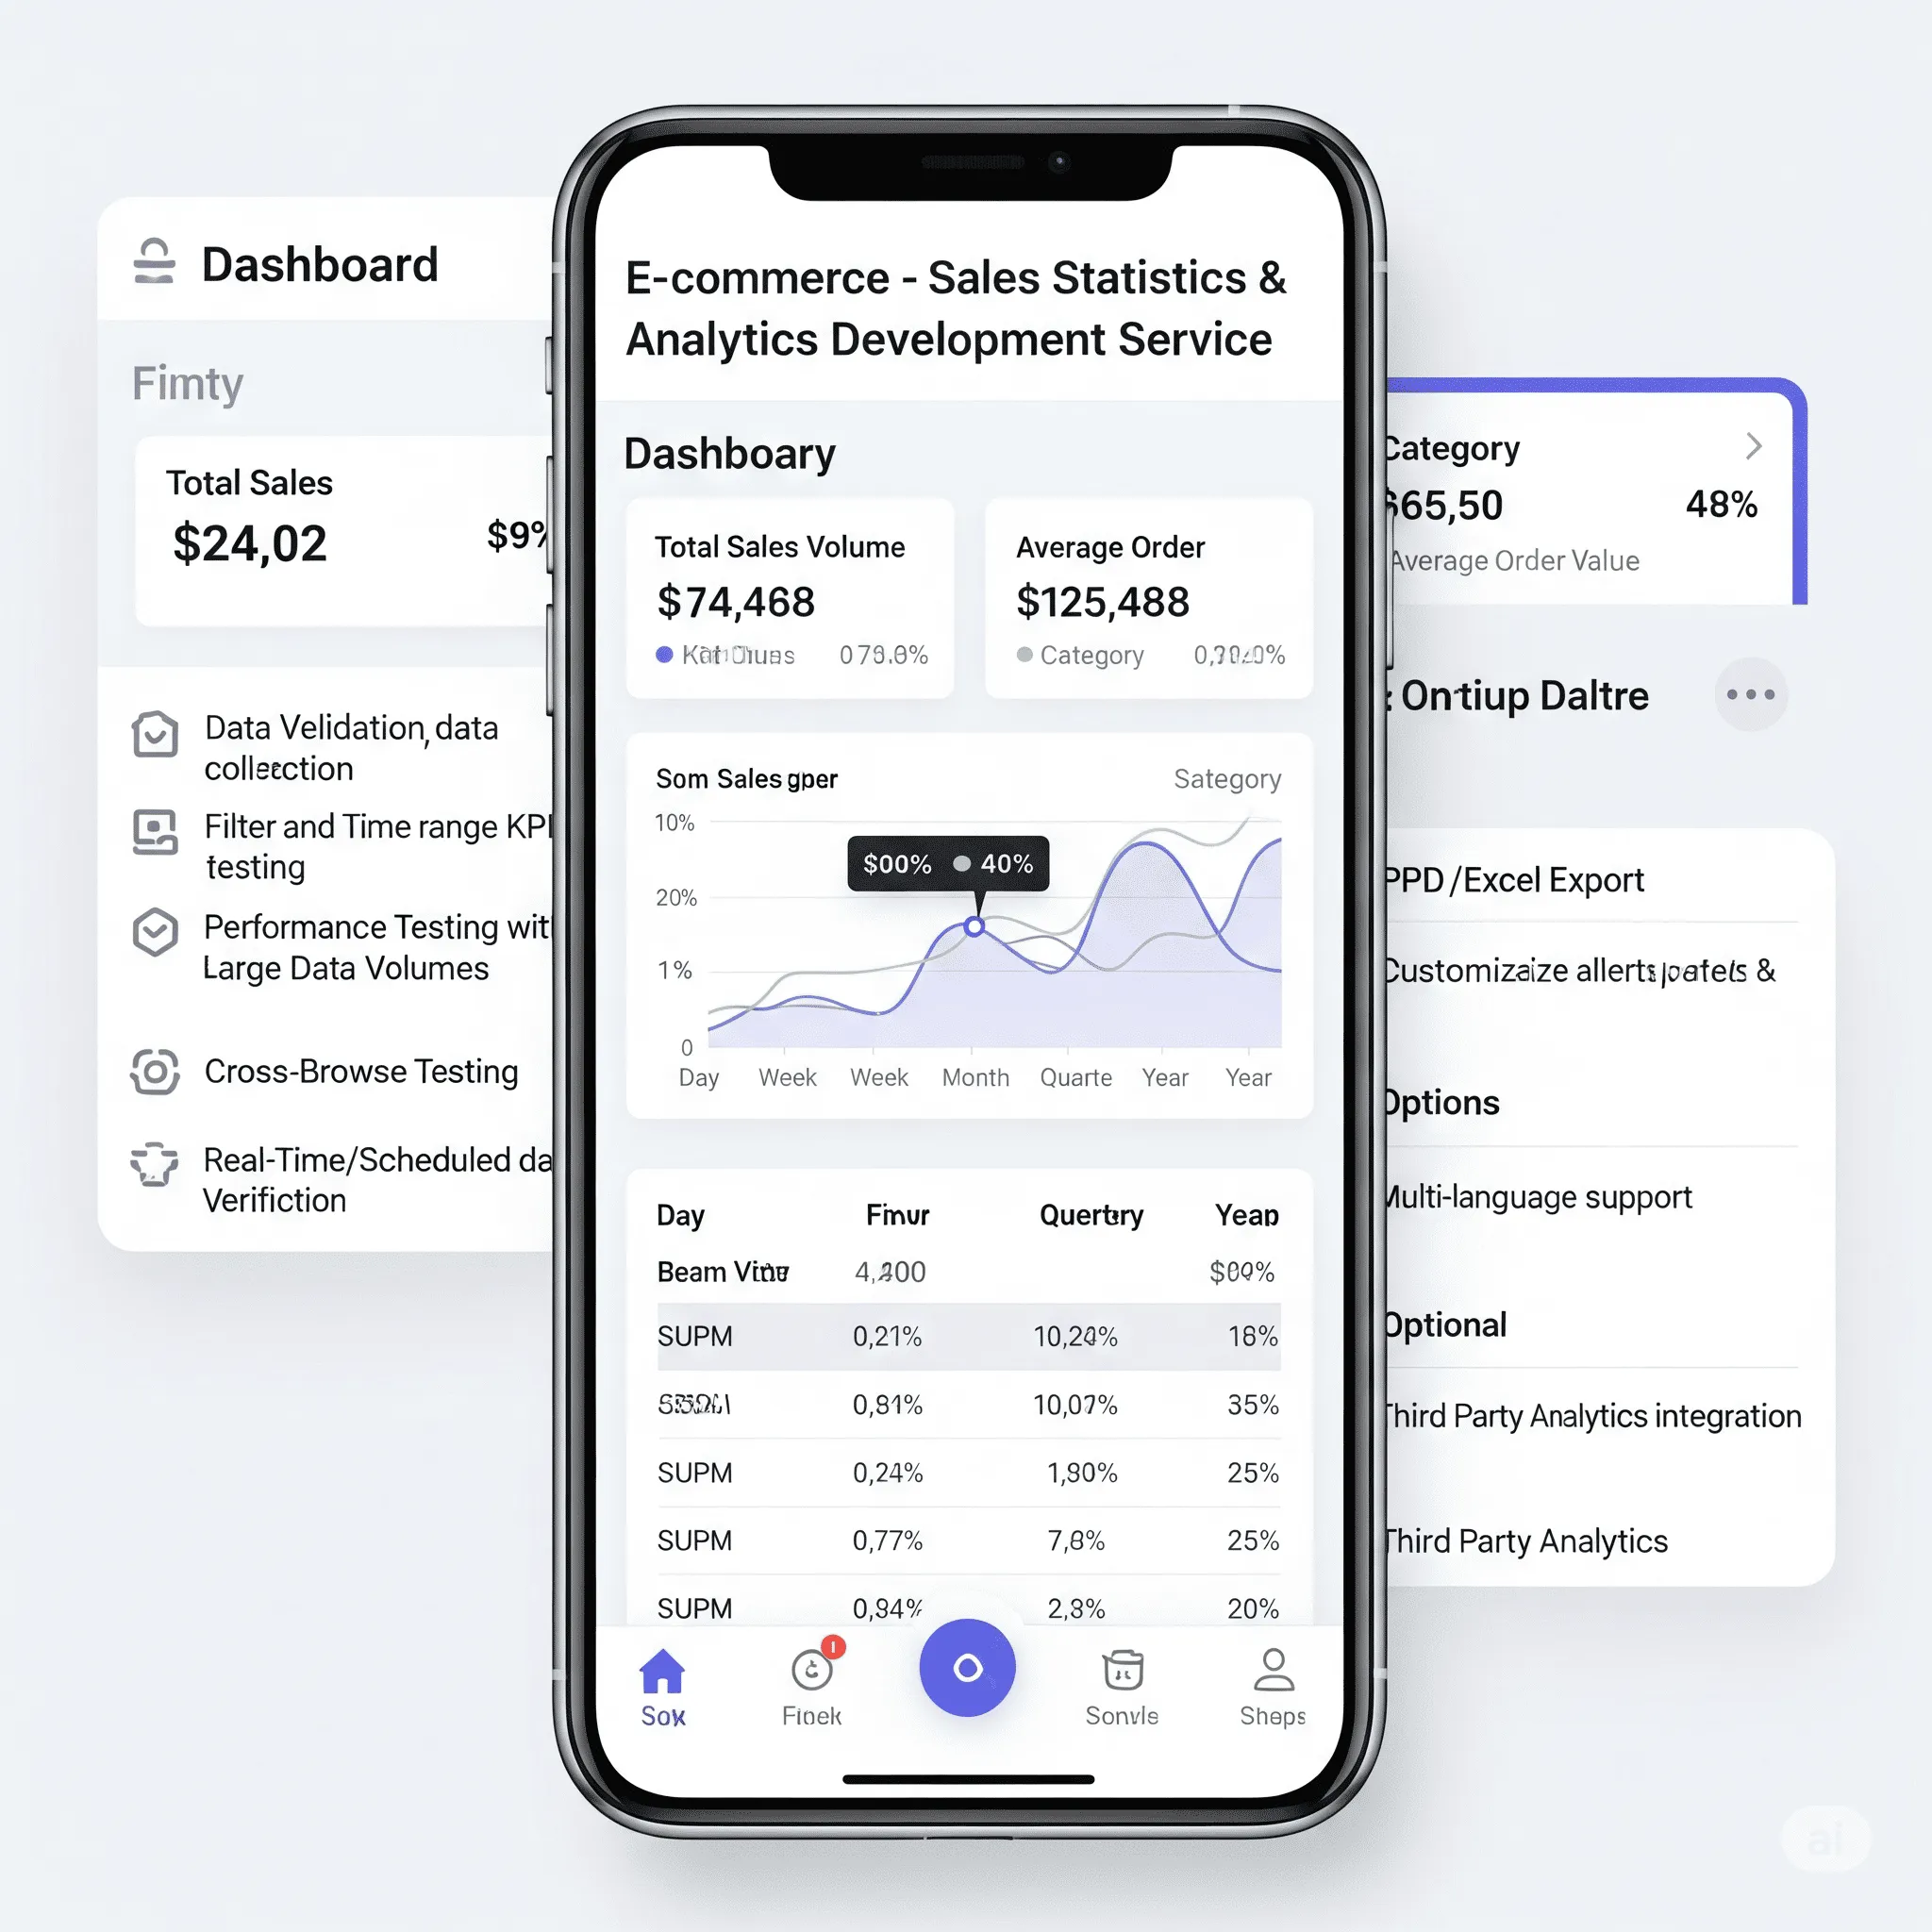
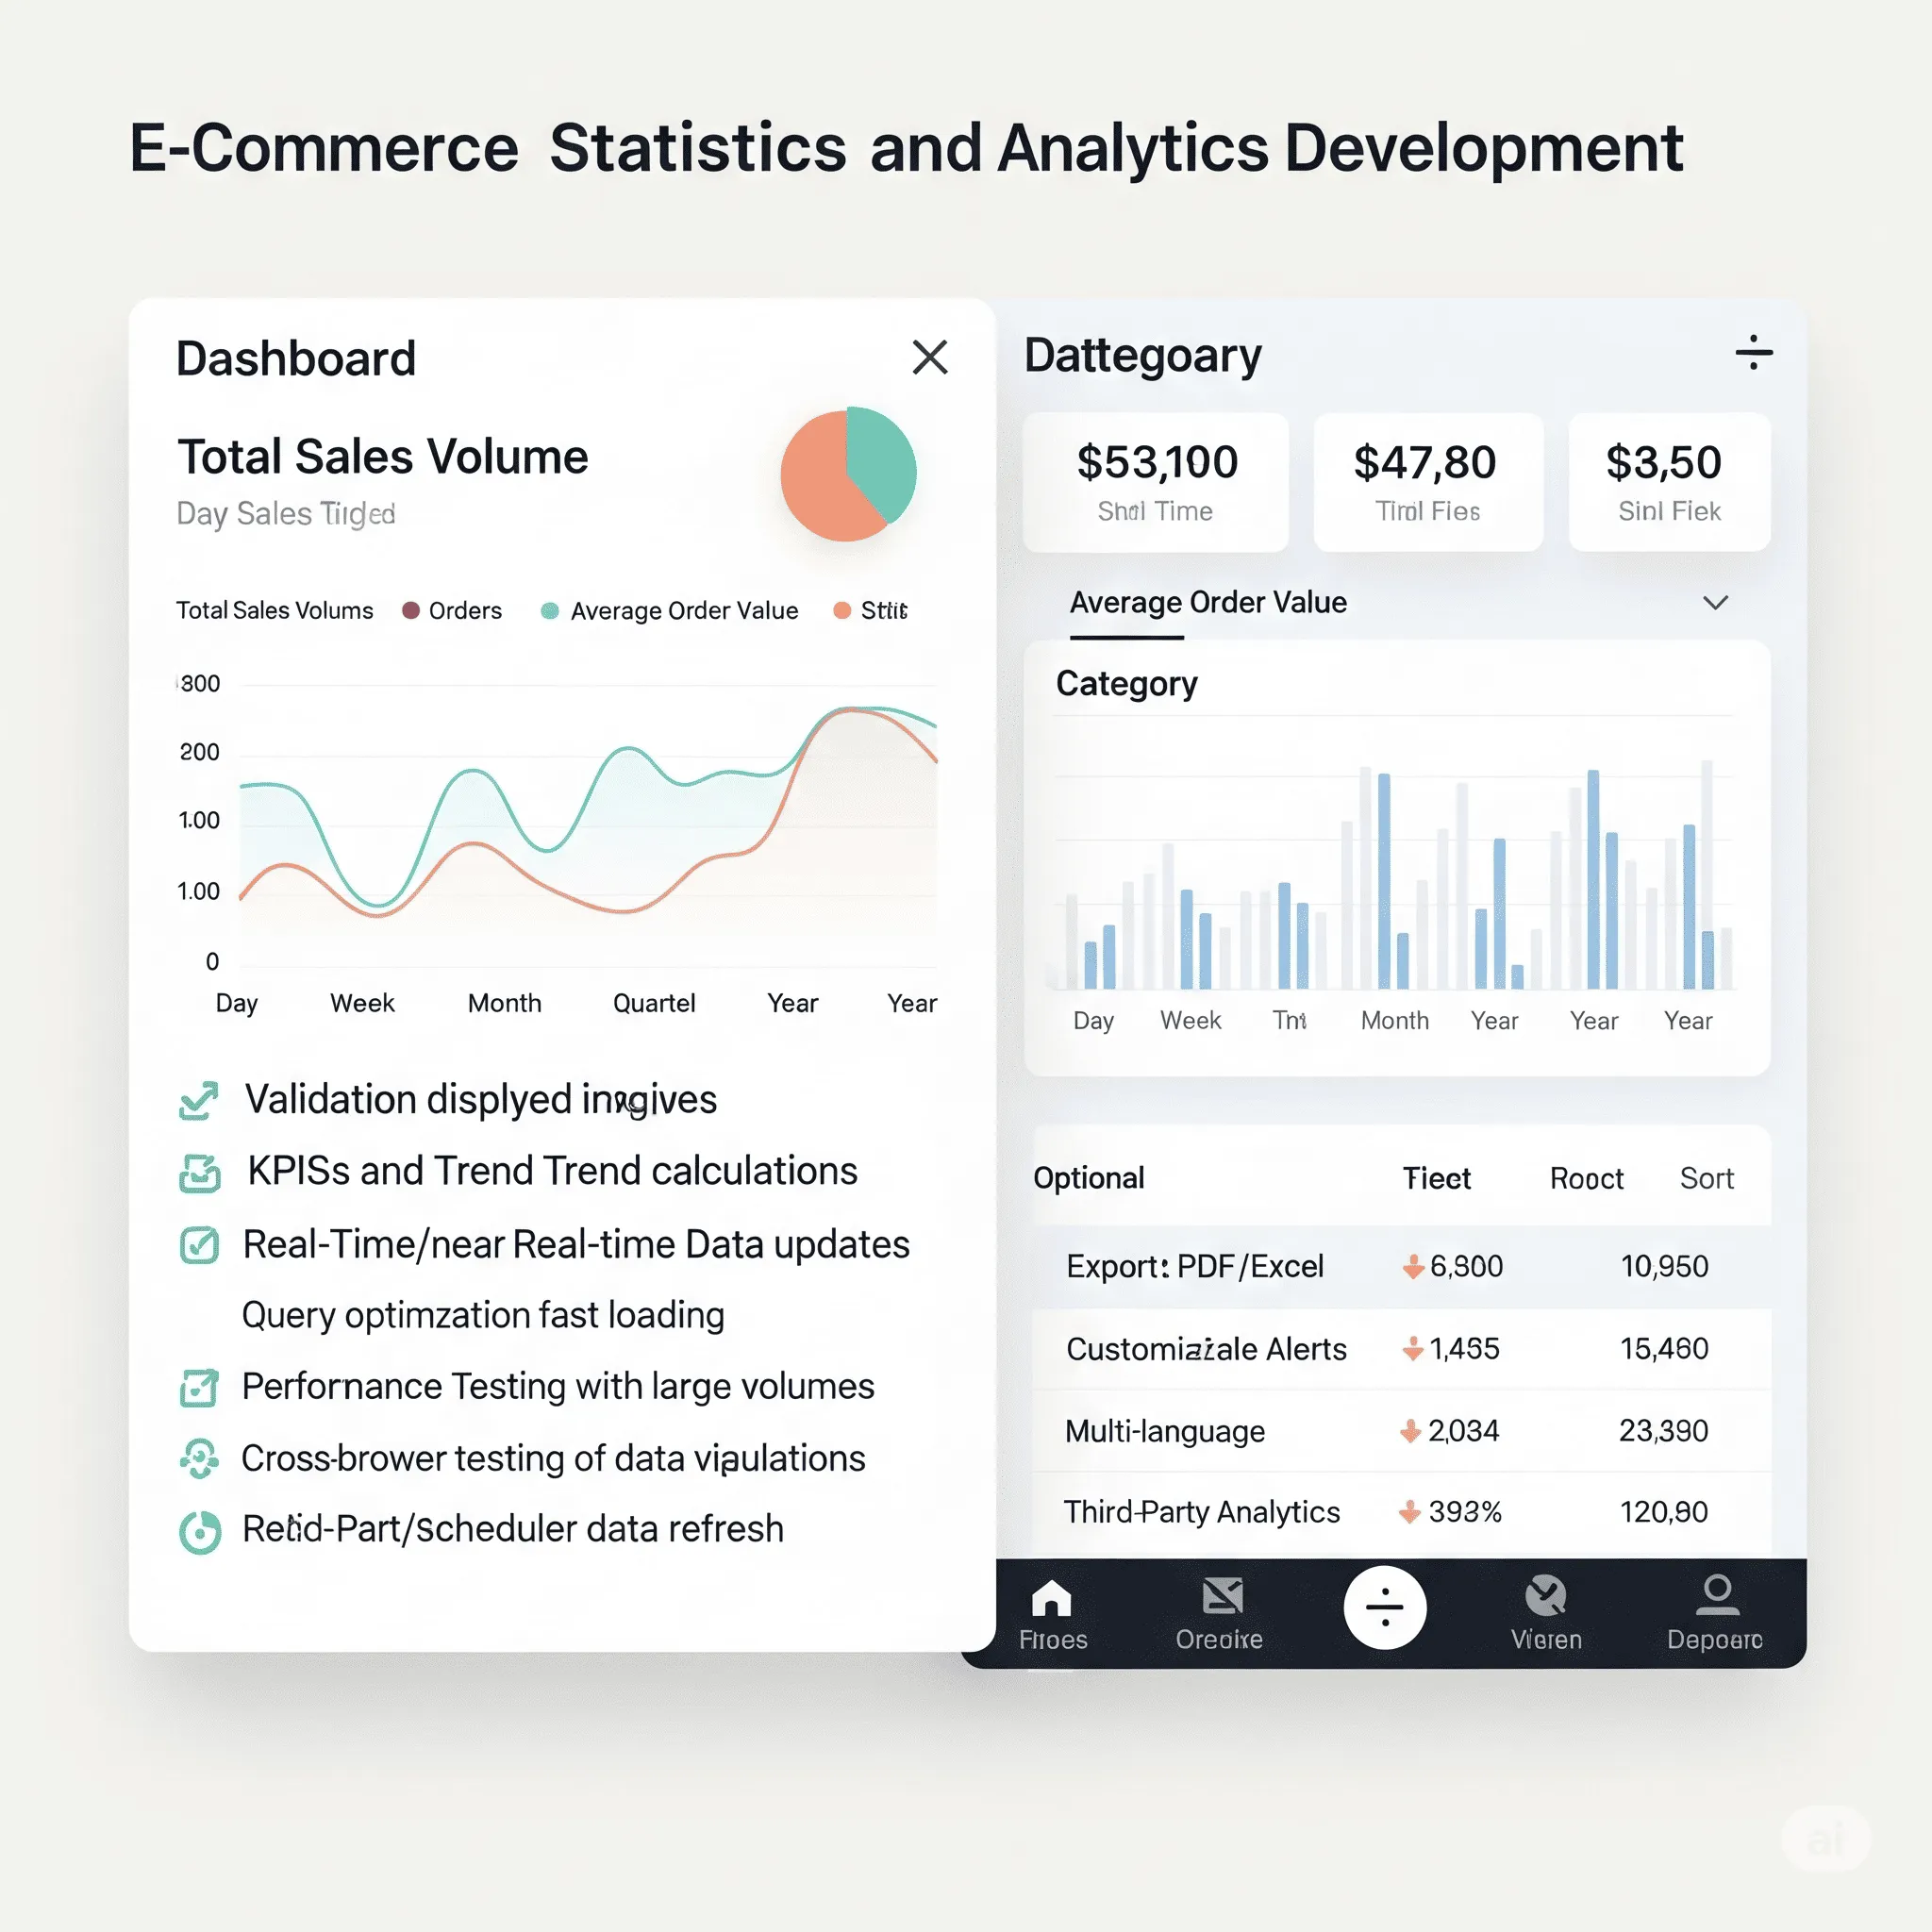
A fully functional analytics dashboard featuring interactive charts (line, bar, pie), KPI summaries (sales volume, order count, average check), filters by date and category, and mobile responsiveness. Server-side filtering and optimized queries.
Yes. You can define which metrics to display, set custom time ranges, and even request export options or alert notifications. These are discussed directly with the developer.
No problem - our AI Product Manager Assistant will help you outline the key metrics, recommend best practices for visualization, and prepare a clear technical brief for the developer.
Perfect for growing eCommerce stores, SaaS platforms, marketplaces, and founders looking to monitor performance in real time. This module features a fully interactive analytics dashboard with key KPIs, filters, and export options - enabling fast, informed decisions. Optimized for mobile and designed to scale as your data grows. Common clients: online retailers, B2B platforms, marketing teams, and business analysts. CMS/API ready and suitable for integration with third-party BI tools.
Join for Early Access
⚡ Limited offer — only before public launch.
Get pre-launch access to the AI Product Manager Assistant and save:
 $425
($500)
$425
($500)
 $297.5
($350)
$297.5
($350)
 $212.5
($250)
$212.5
($250)
 $425
($500)
$425
($500)
Clients praise this module for delivering instant clarity on their business performance. They especially value the clean dashboard layout, customizable charts, and real-time data updates - all of which help streamline decision-making. Many noted how the intuitive filtering by category and time period allowed them to spot trends and optimize marketing strategies. The mobile responsiveness and fast-loading interface received positive mentions, particularly from managers checking metrics on the go. Clients also highlight the module's seamless integration with sales databases and the ability to export detailed reports when needed.