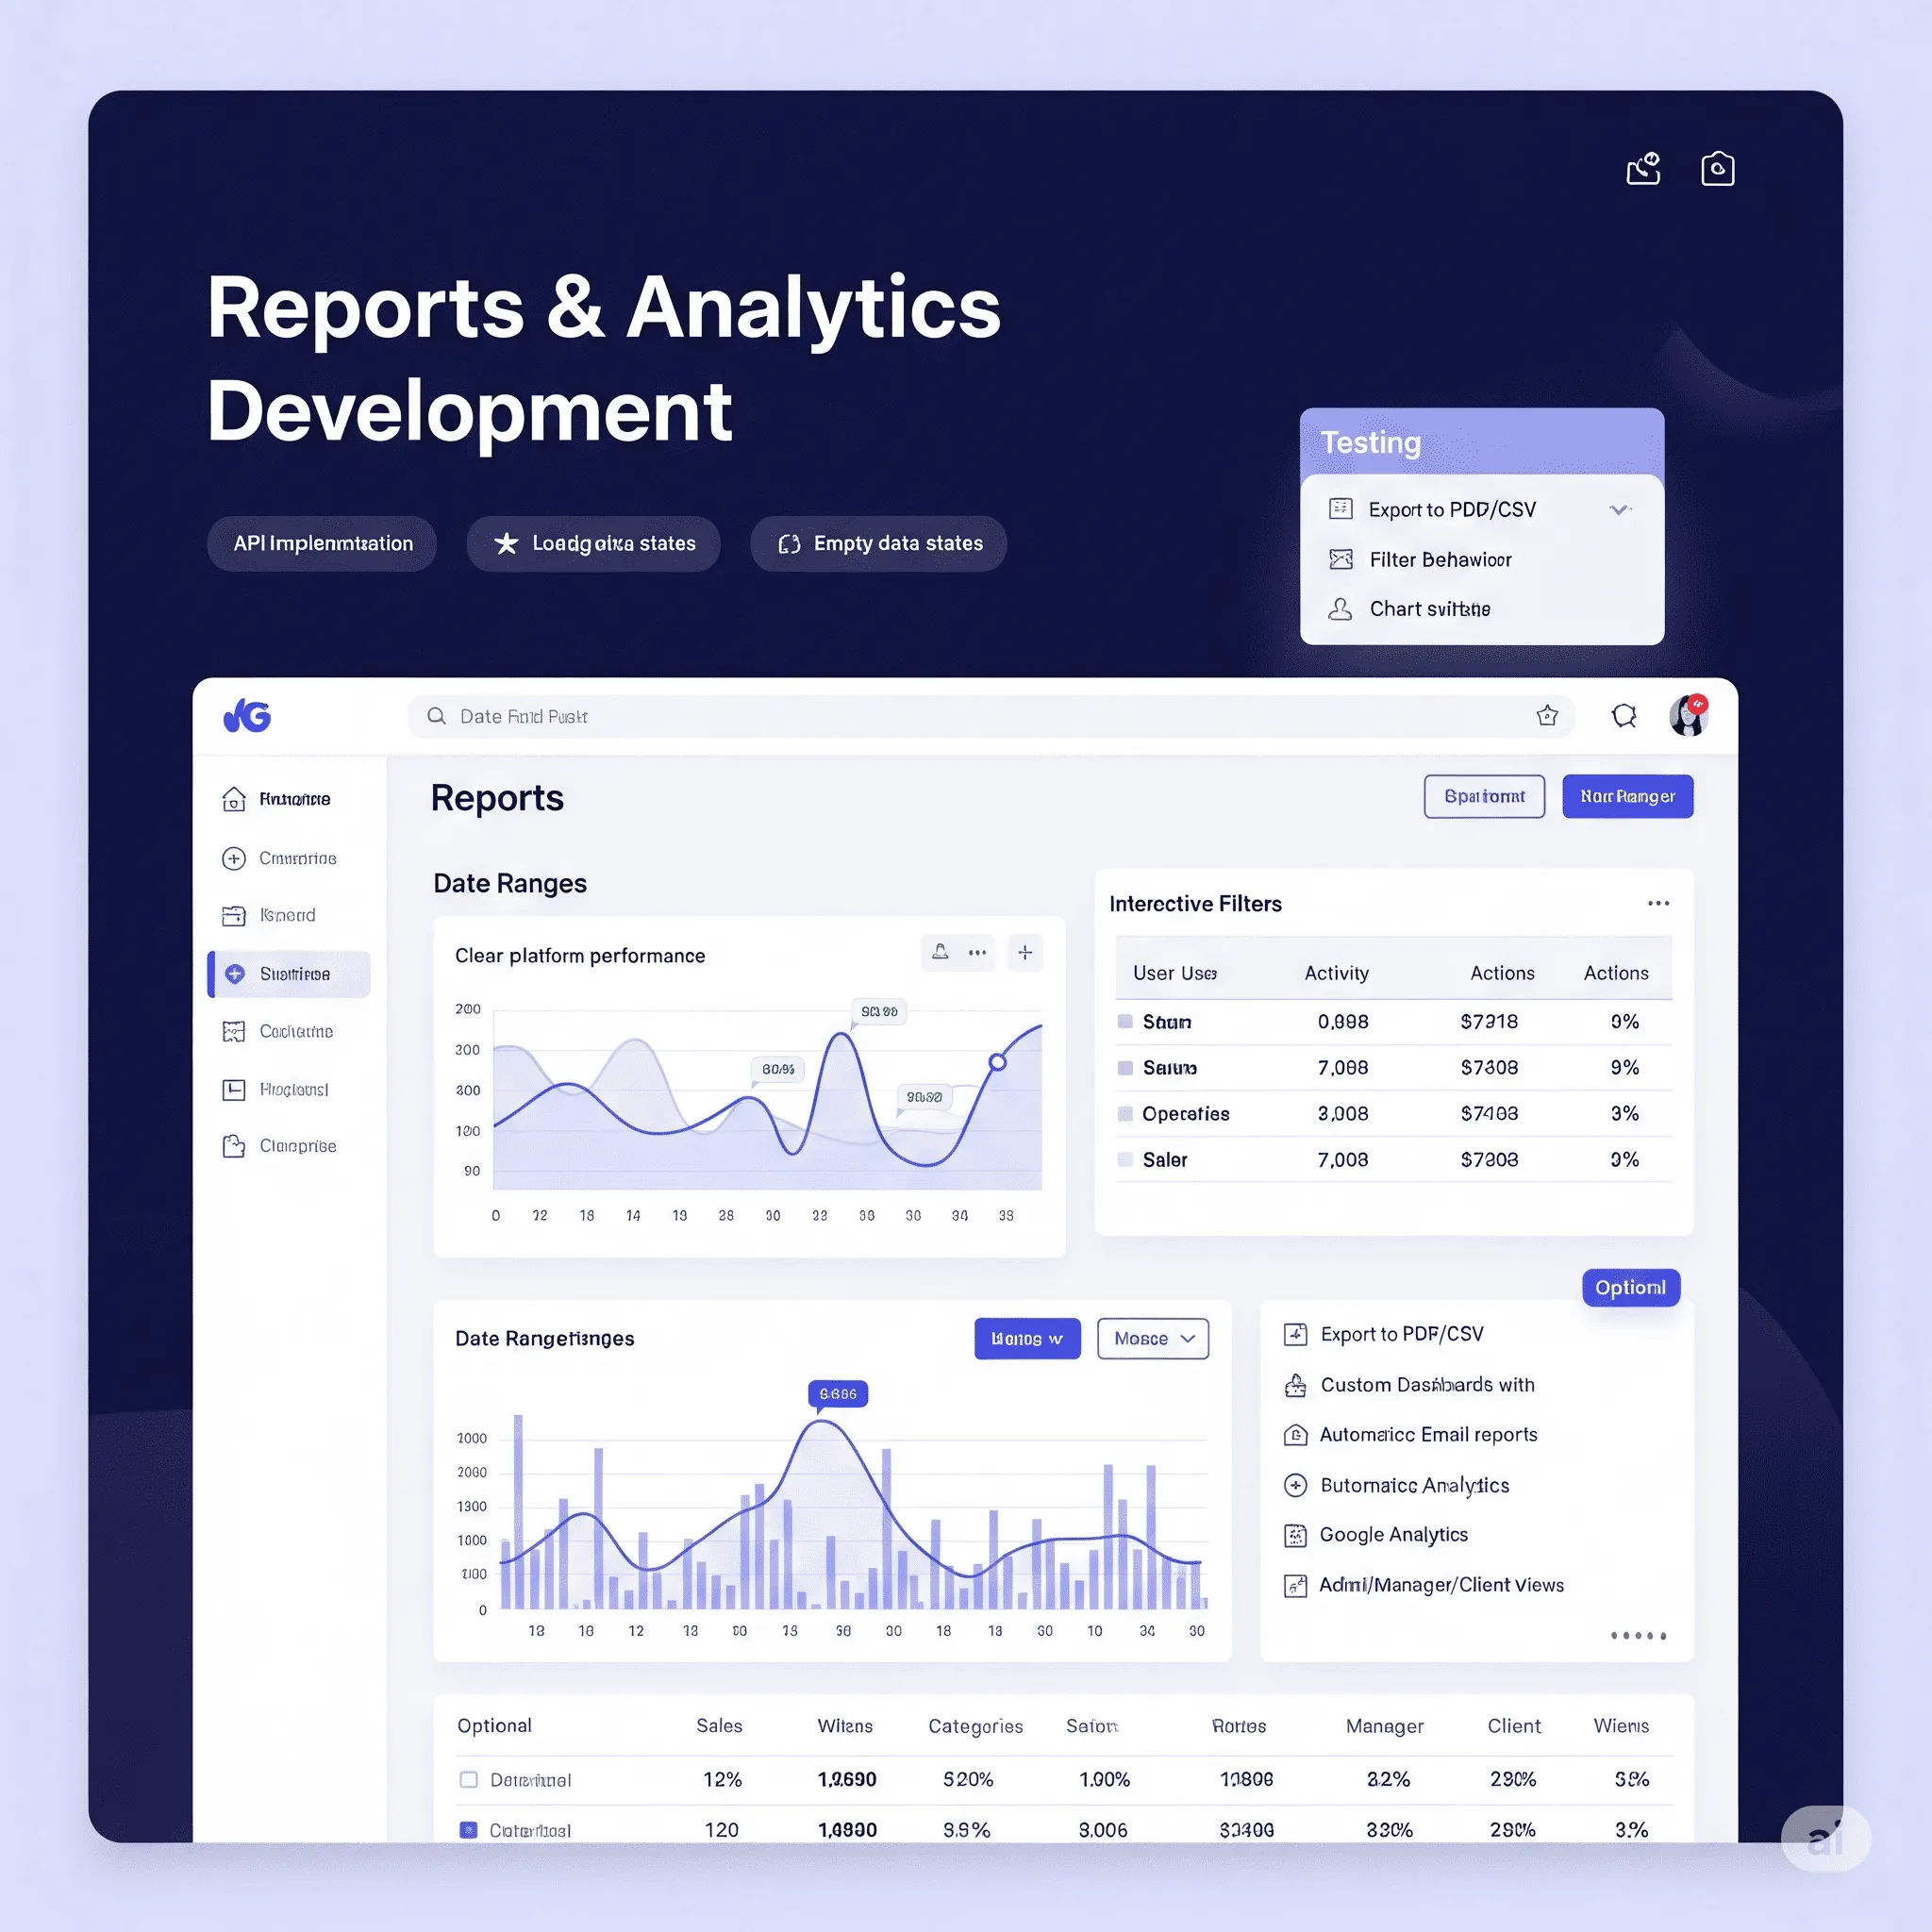
Feature goal: Provide clear and actionable insights about your platform’s performance, user activity, sales, or operations through visual dashboards and detailed reports.
🎉 Price from: $221 ($260)
You save: $39 (15%)
Rates: Junior $8–$12/h | Middle $20–$25/h | Senior $30–$40/h
Timeline: 3-5 days
You select the Reports and Analytics module, register, and describe what kind of metrics or dashboards you need. A certified developer will then create a tailored solution using your data sources and requirements.
Certified freelancers (Junior, Middle, or Senior levels) complete the development. You can choose the level that best matches your budget, timeline, and complexity.
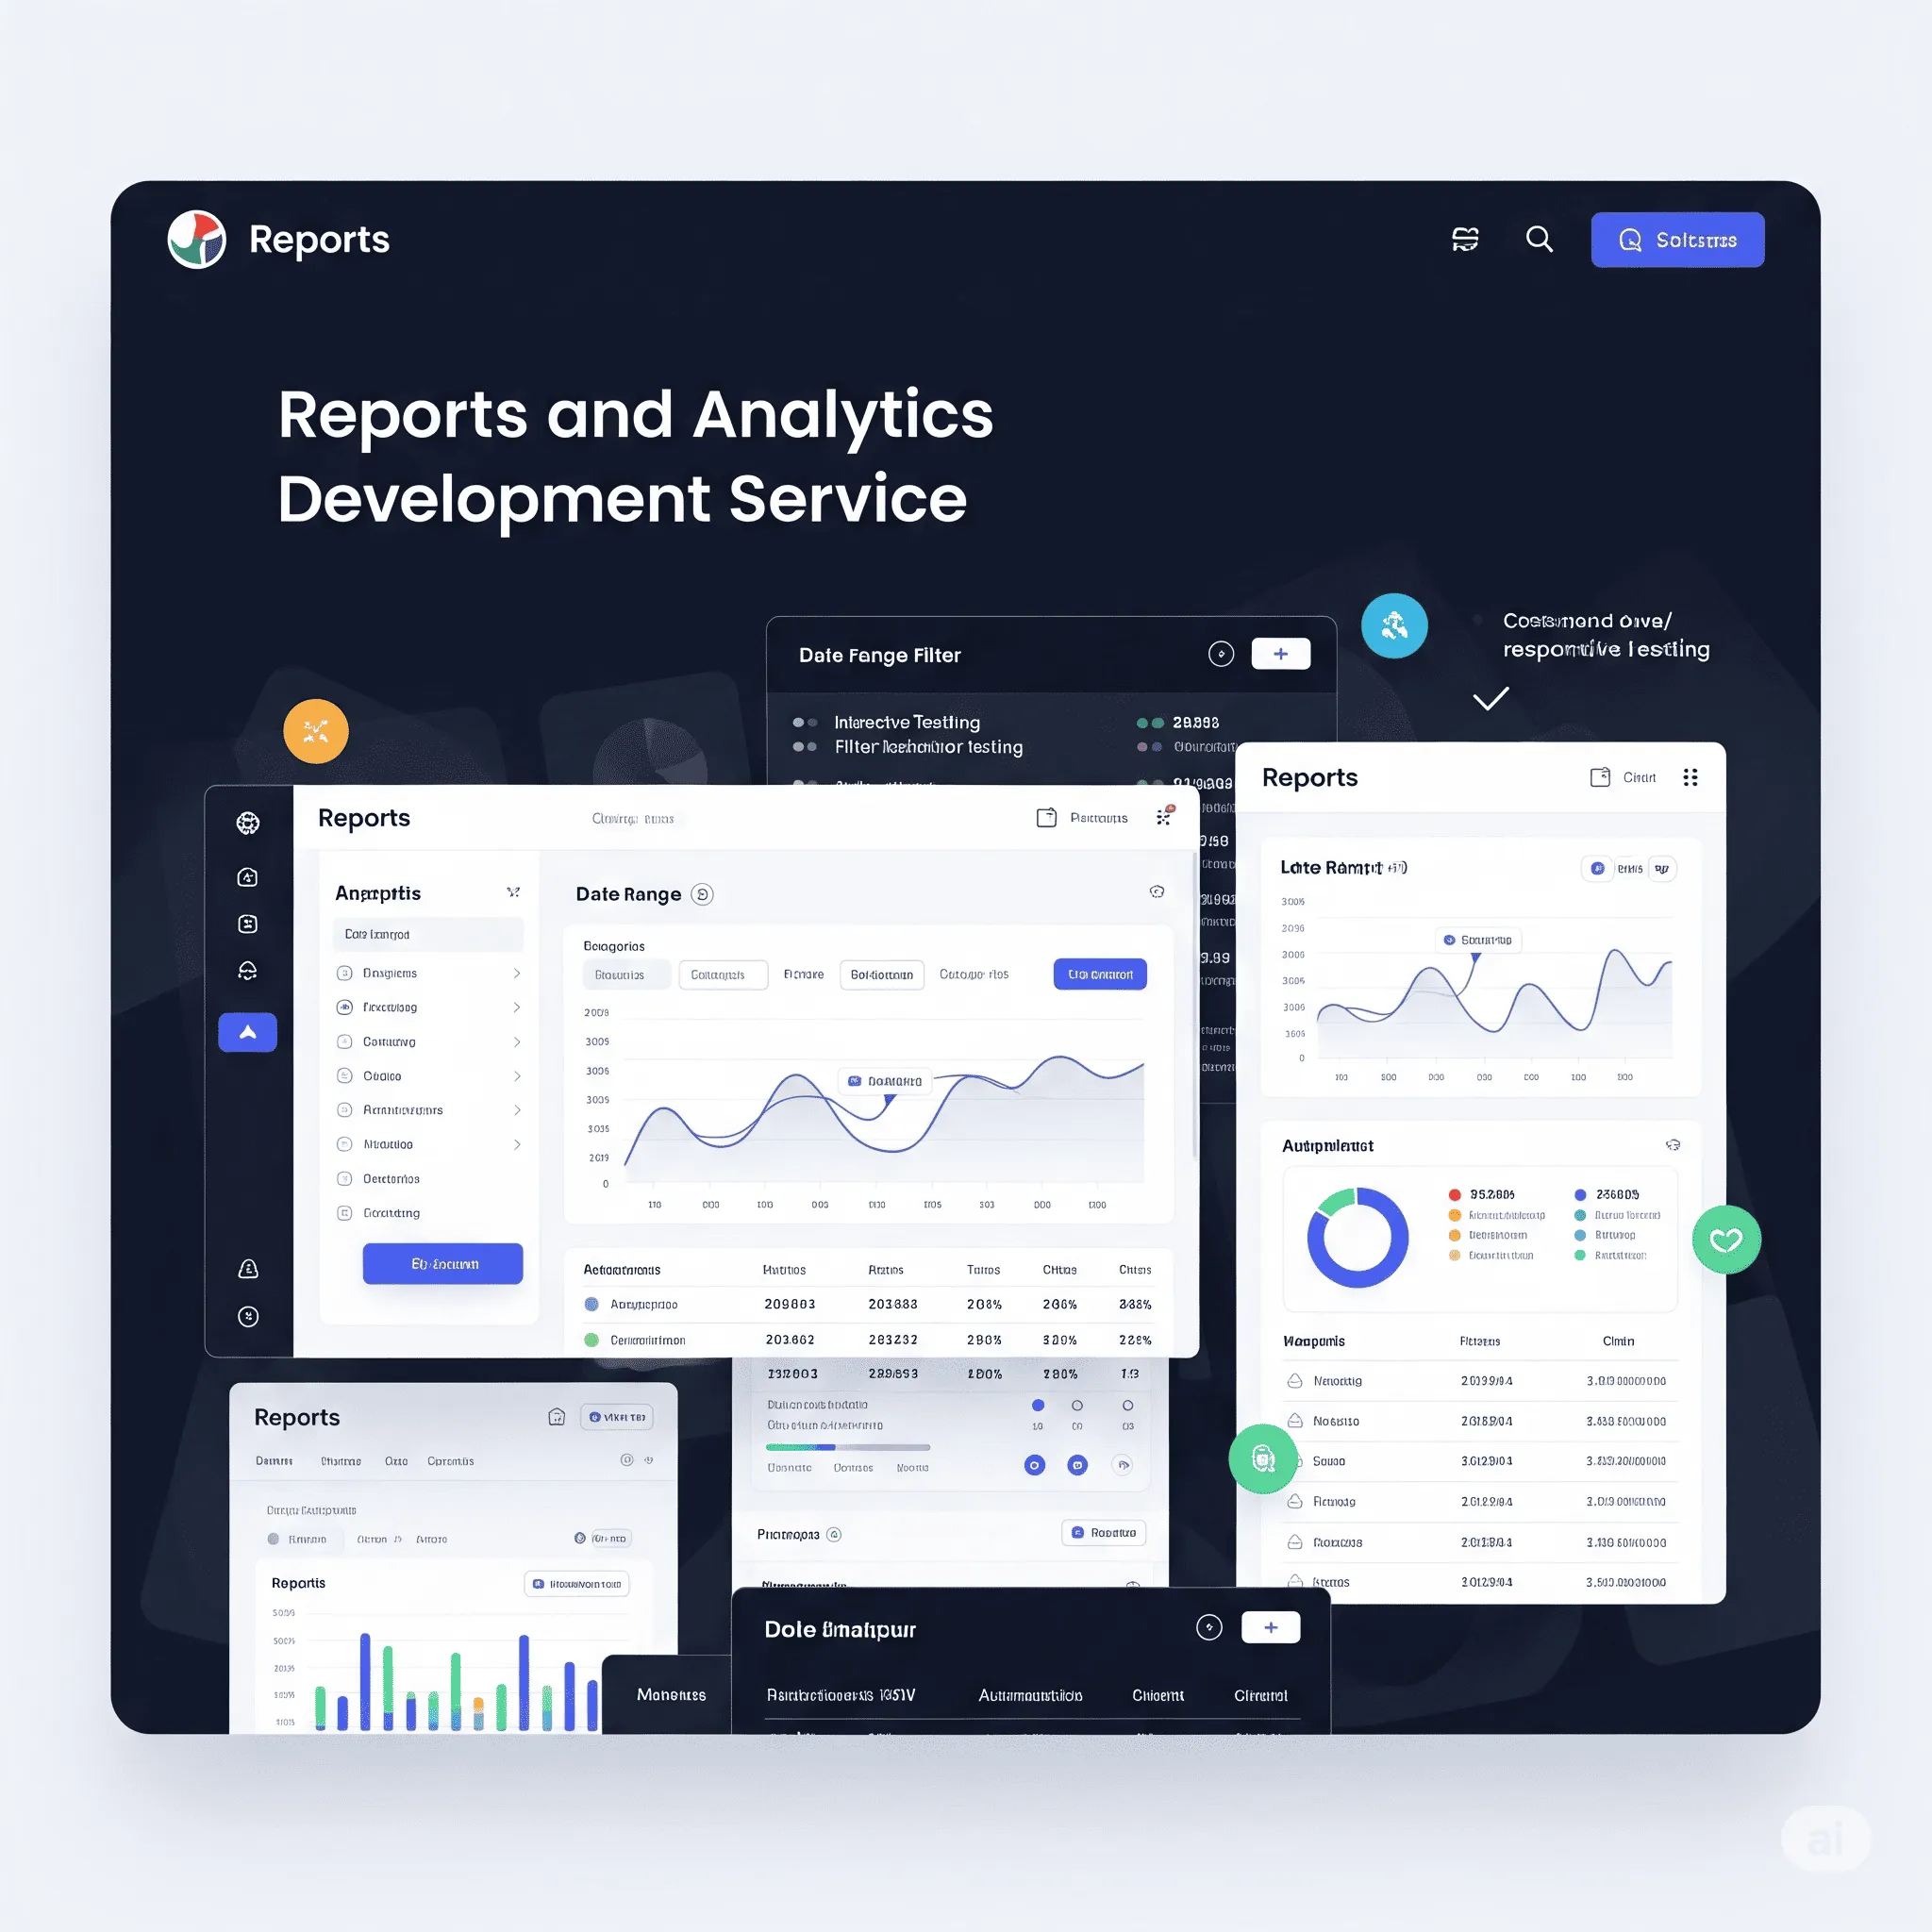
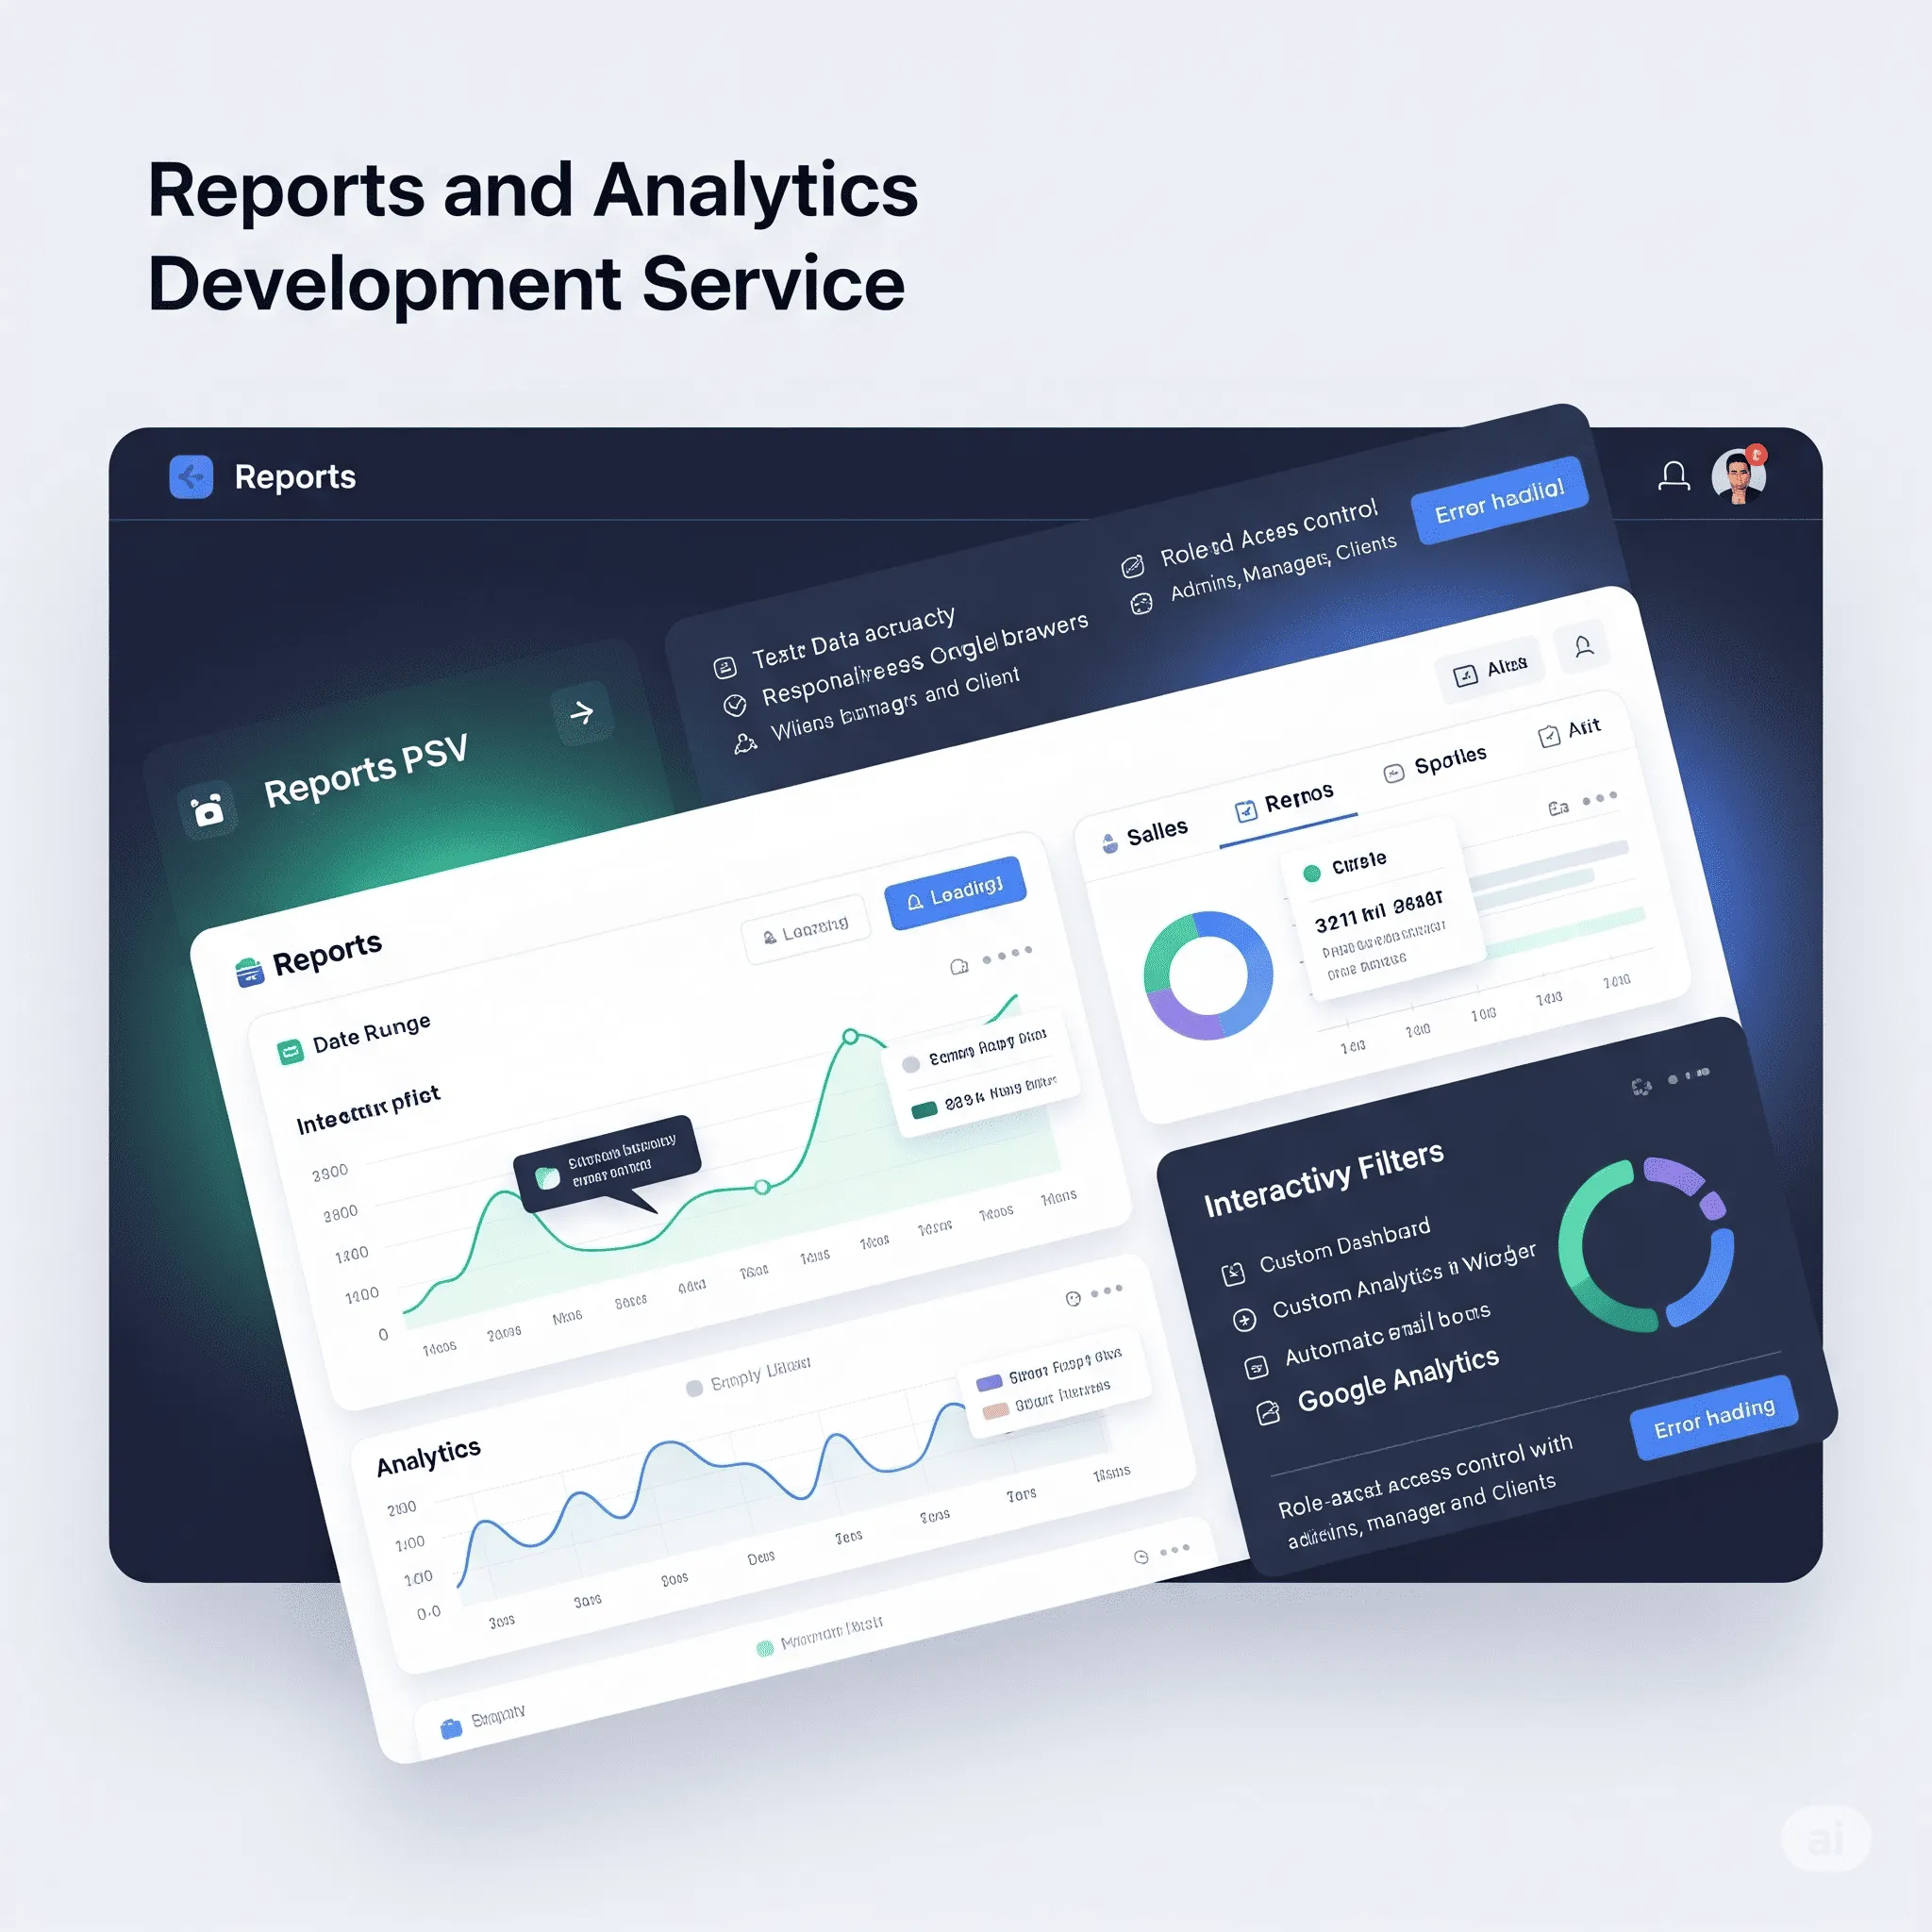
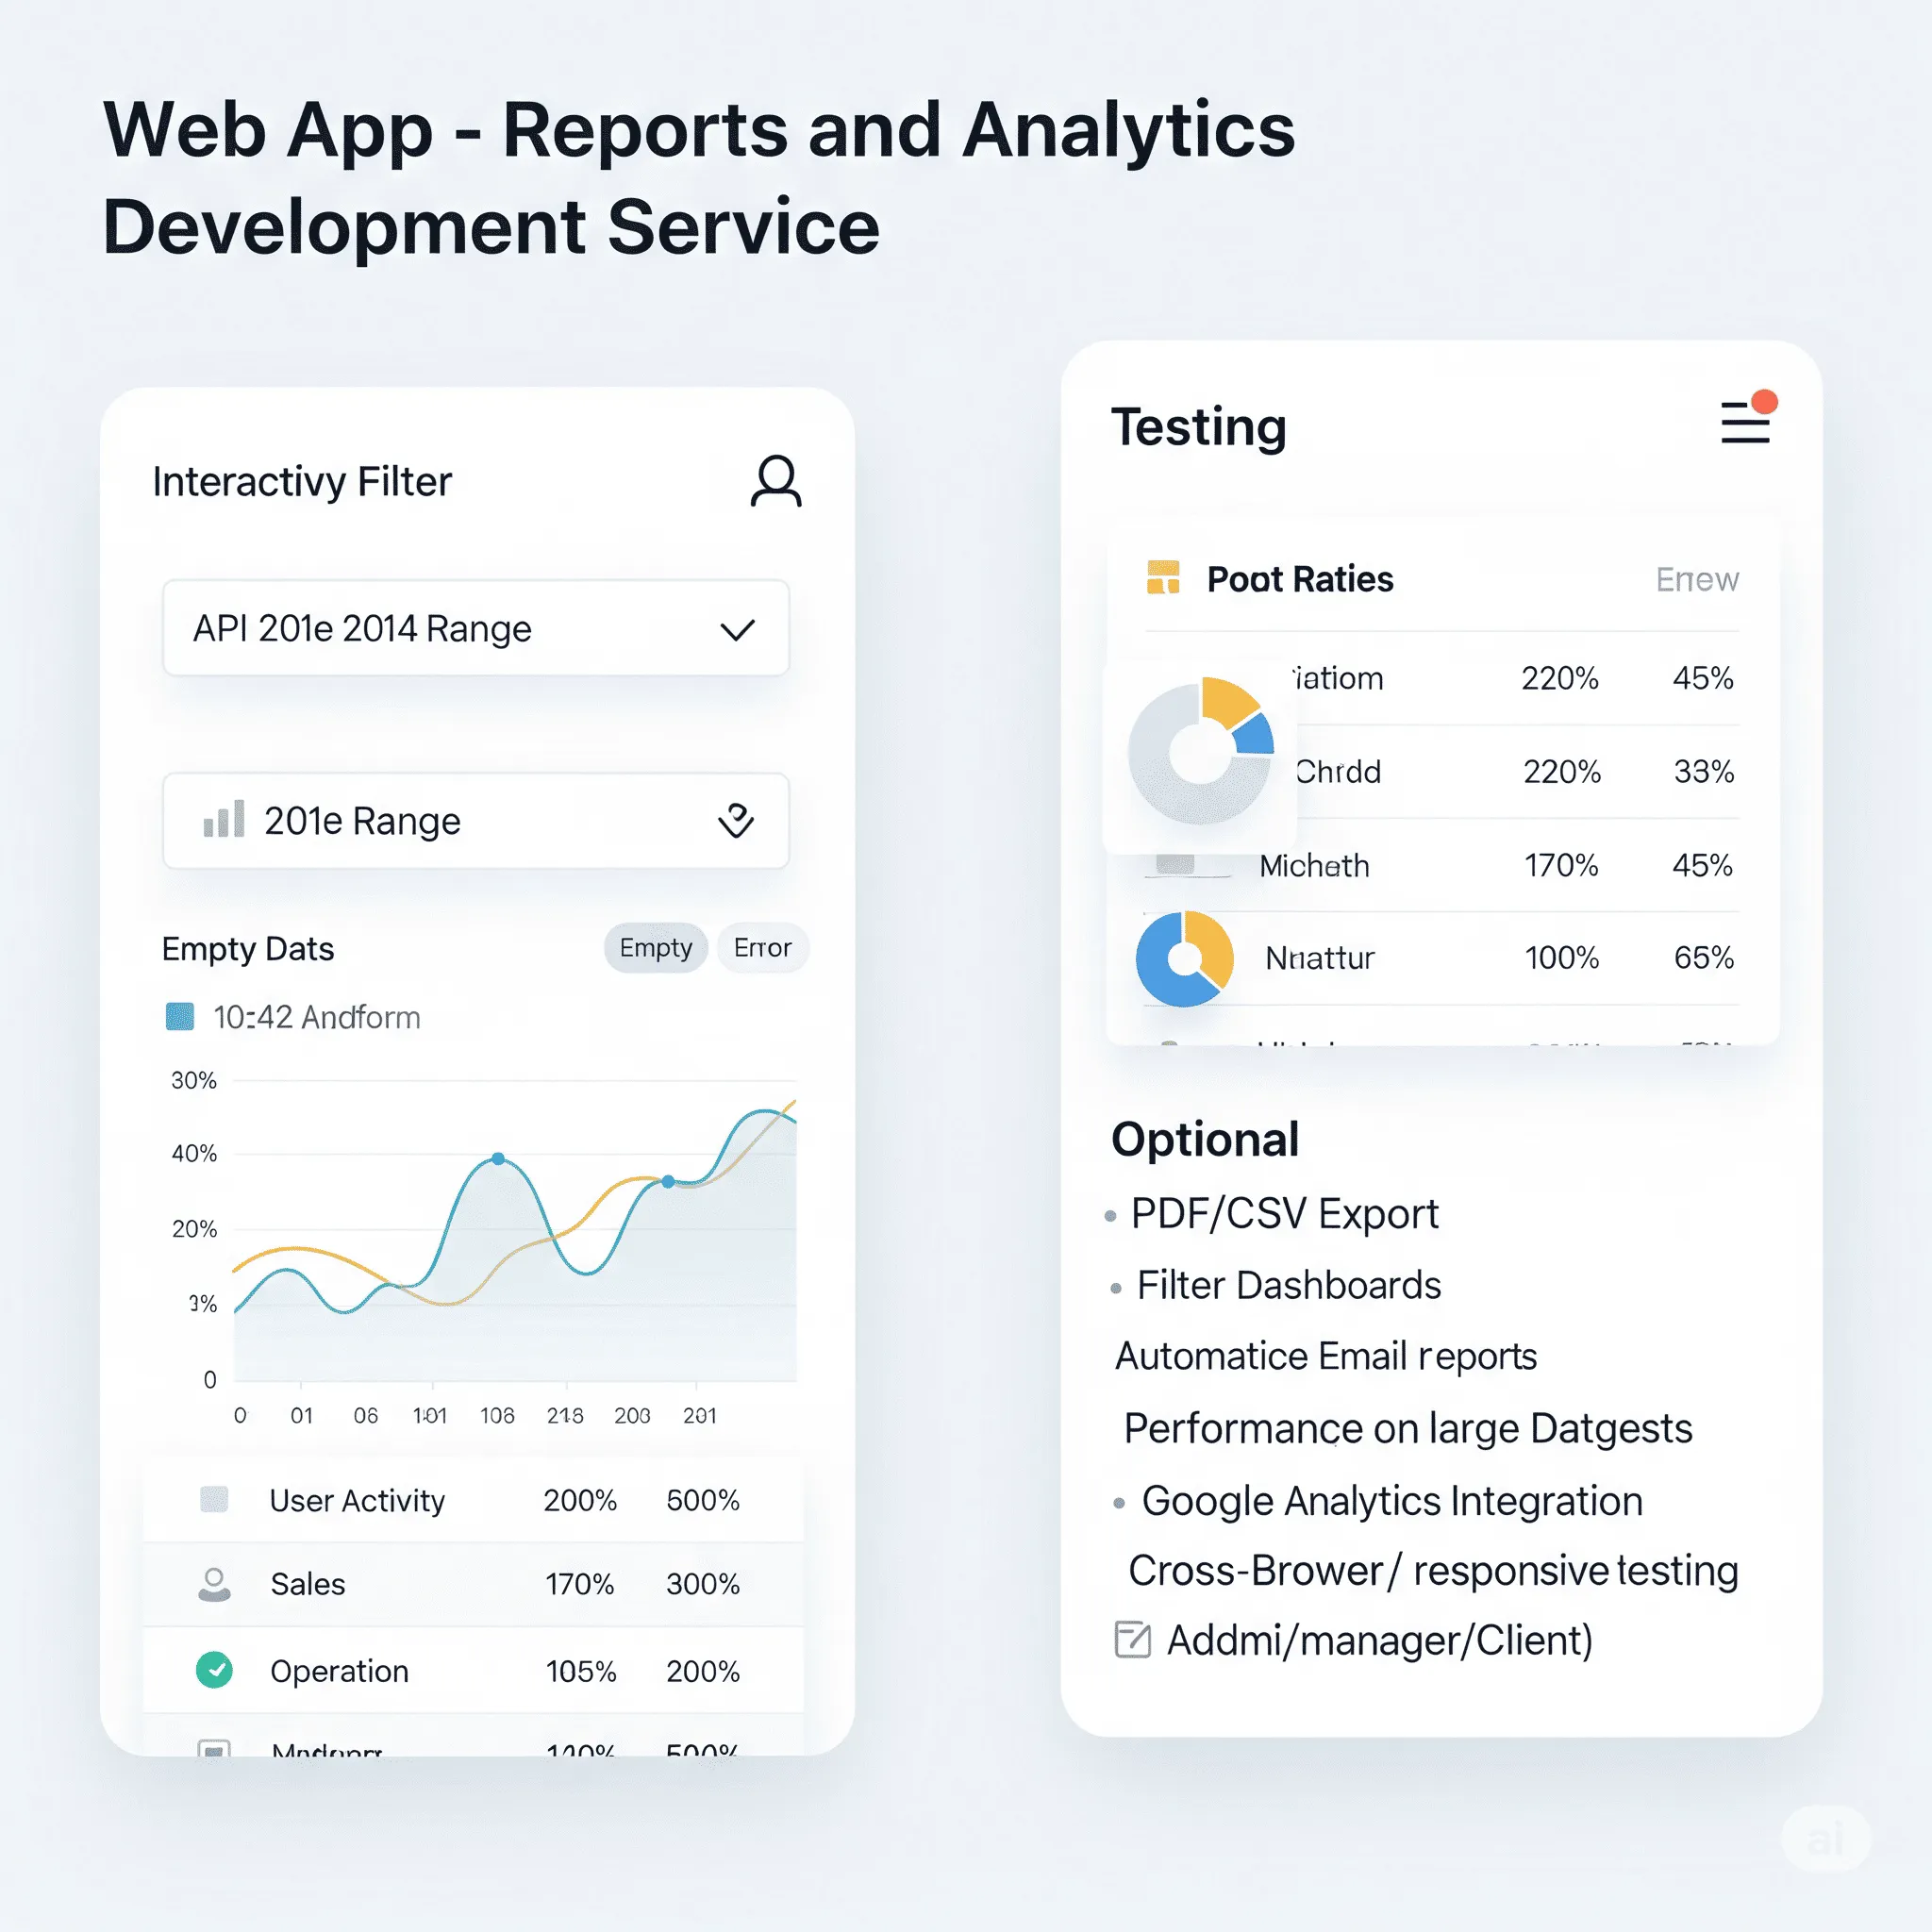
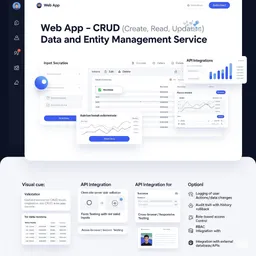
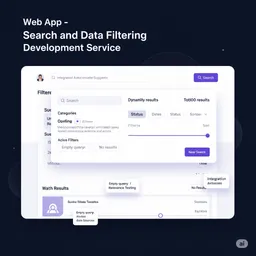
A fully functional analytics dashboard - with charts, filters, date ranges, tables, and summary widgets. You’ll also get API integration and properly handled empty or error states.
Yes. You can provide what data to visualize, how it should look, what filters to apply, and whether export parameters or scheduled reports are needed. Advanced settings are also possible, which you can discuss with the developer.
Don’t worry - our AI Product Manager Assistant will guide you through key analytics options and help you build a clear, developer-ready brief tailored to your platform's goals.
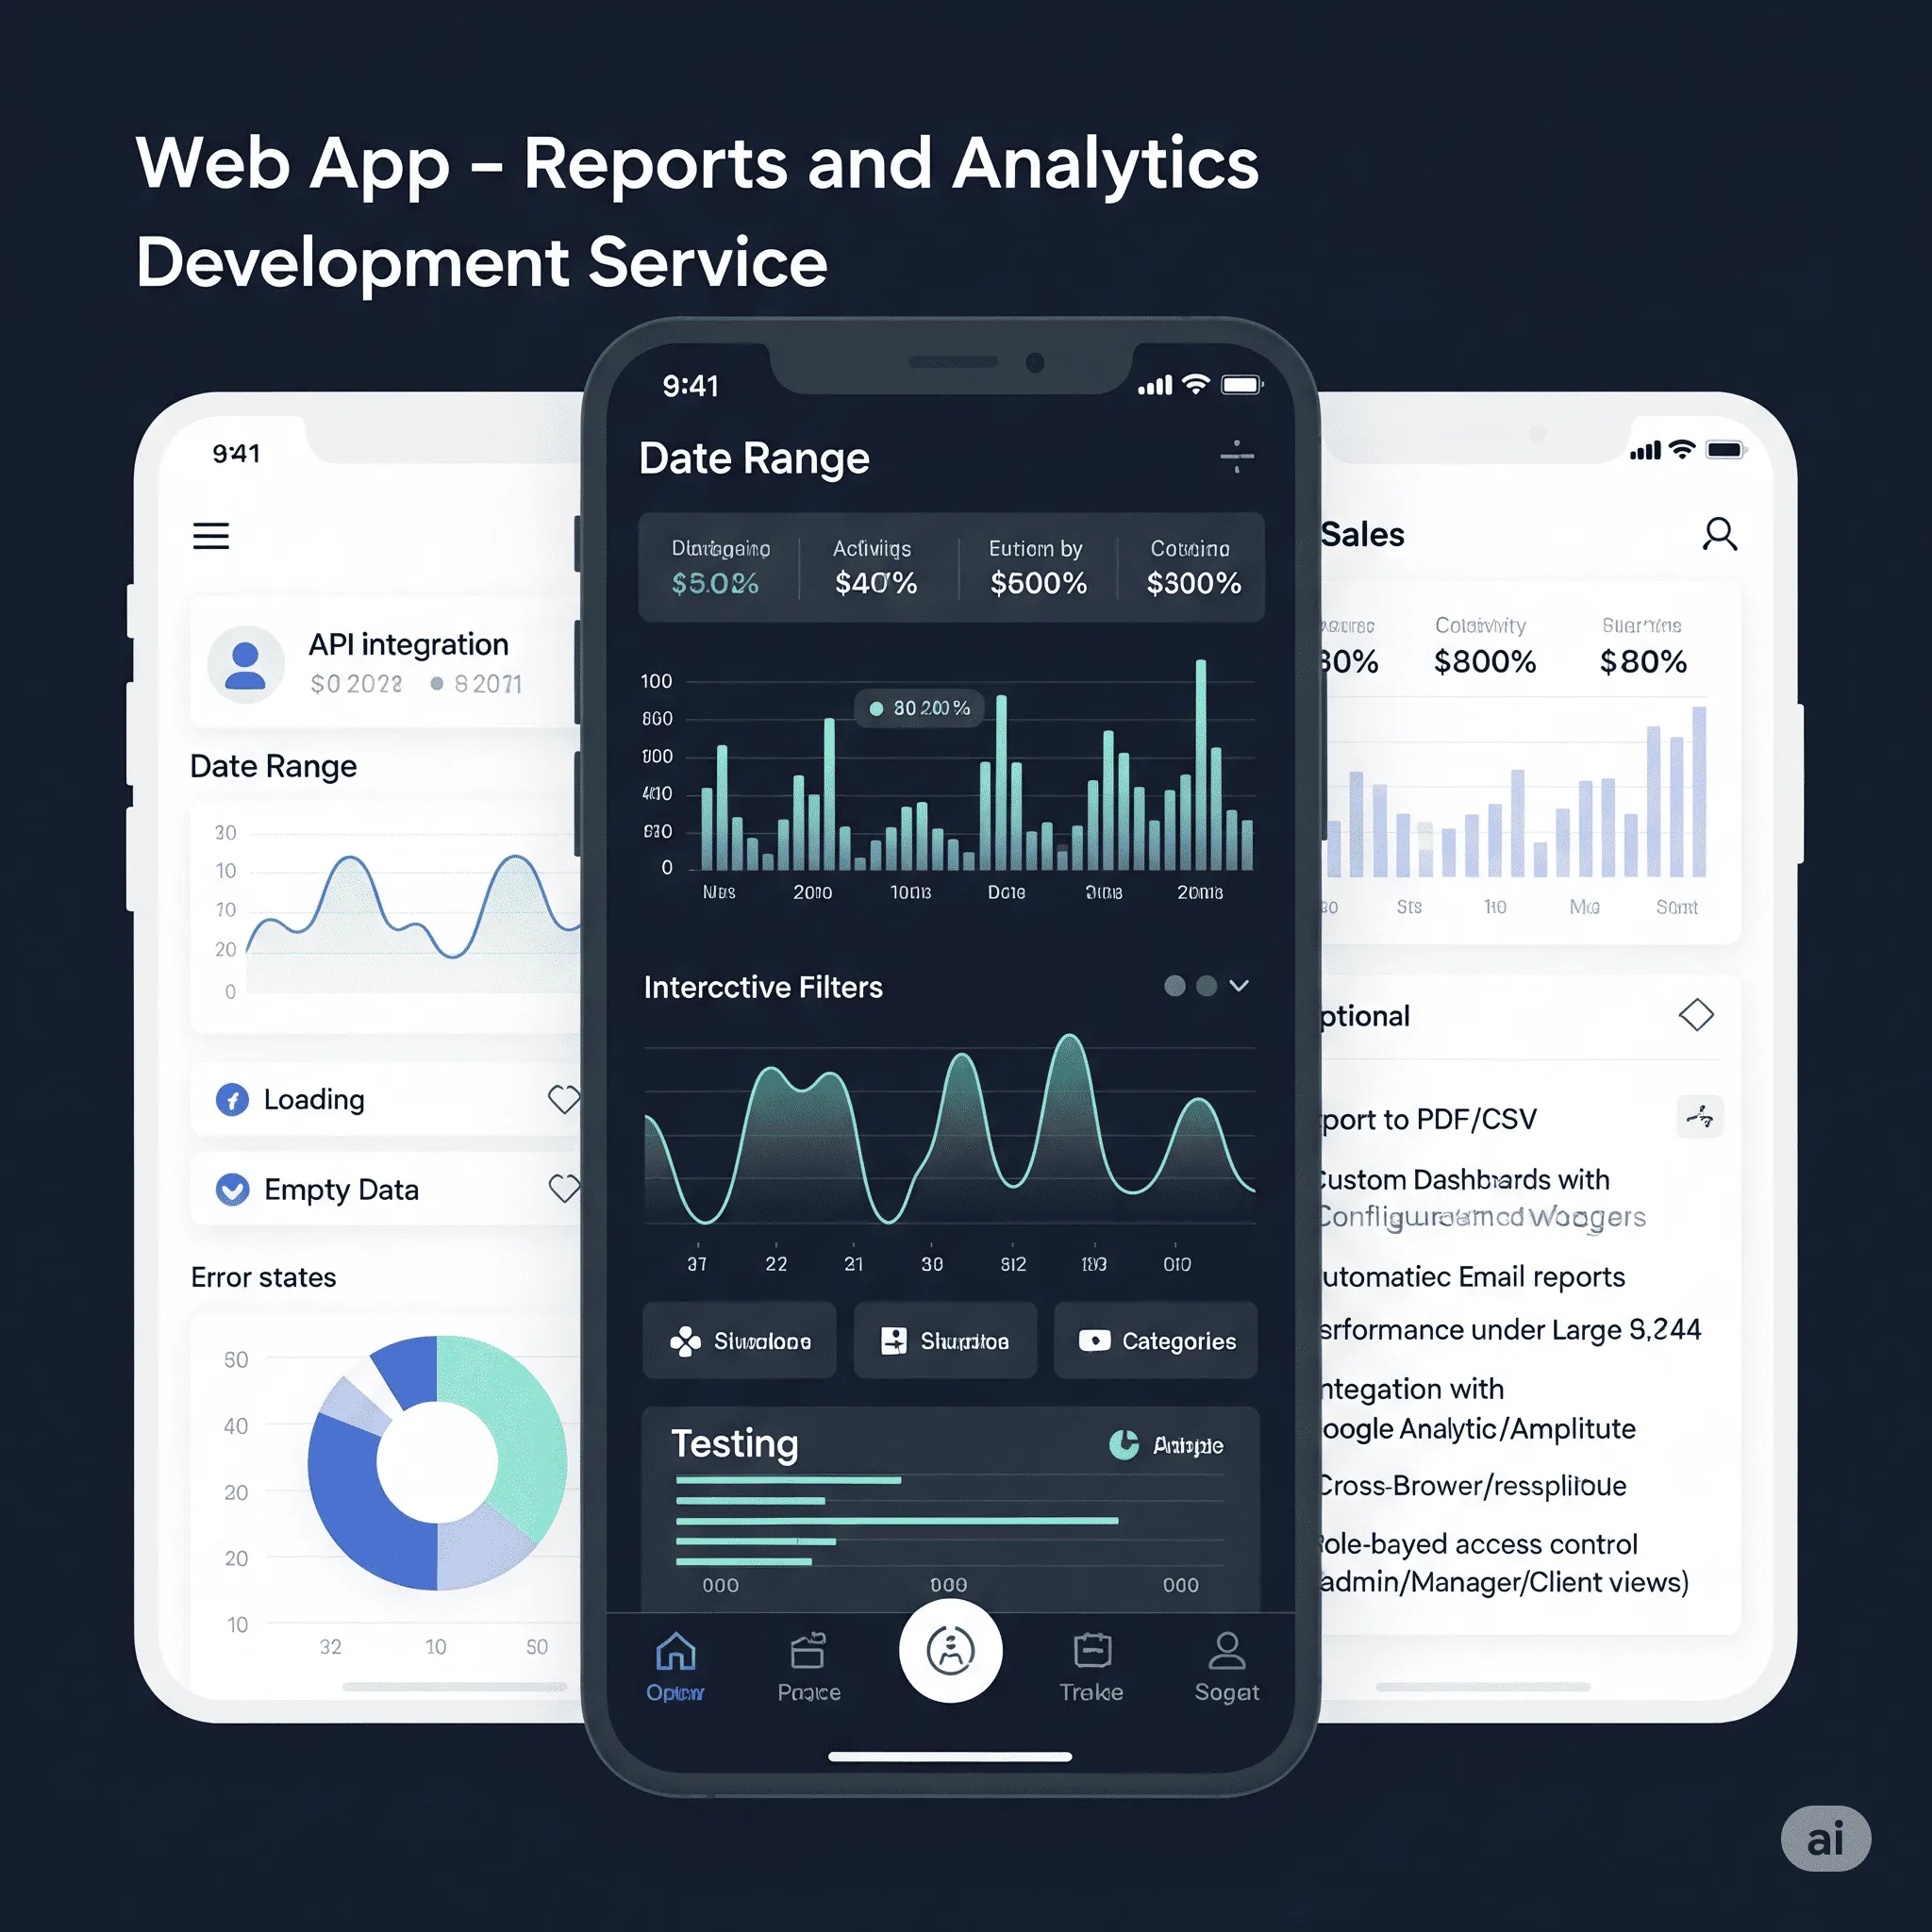
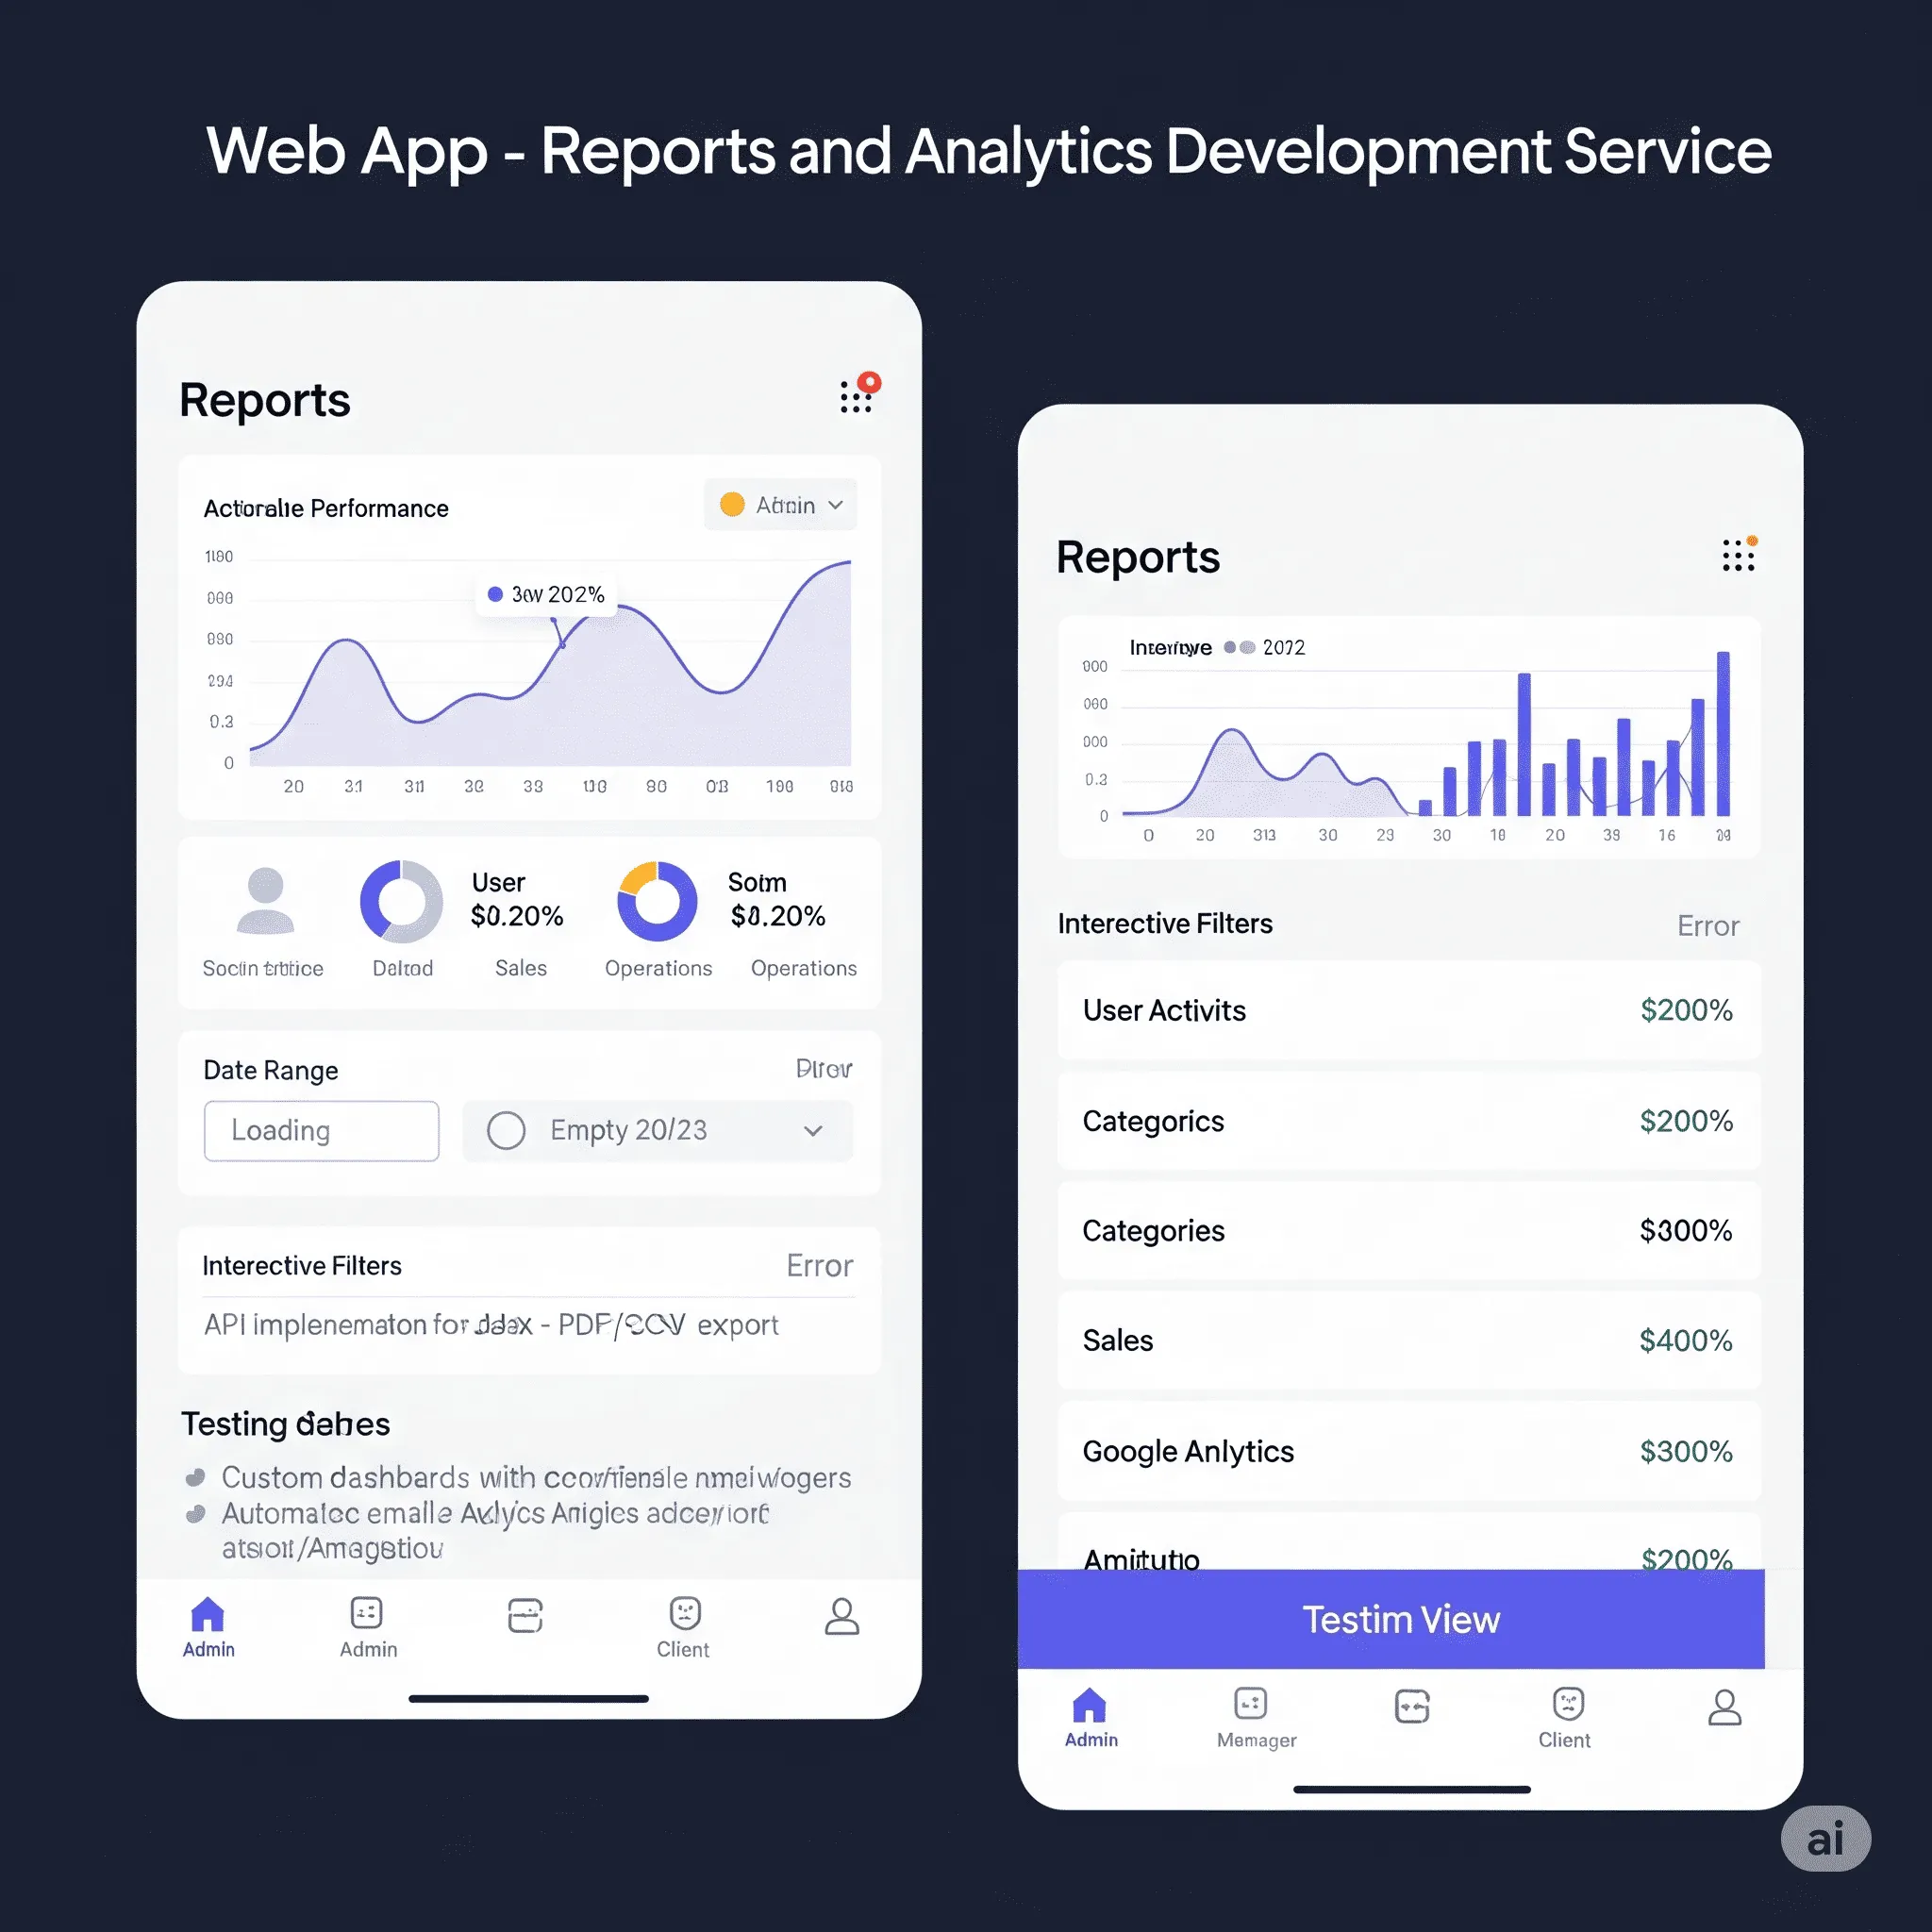
Perfect for SaaS platforms, eCommerce, admin panels, and services that rely on data to make informed decisions. This module includes dynamic dashboards, detailed metrics, and interactive filters - everything you need to visualize user behavior, sales, or system performance. Mobile-optimized, API-connected, and ready for high data volumes. Common clients: founders, product teams, marketers, ops managers, and B2B services building scalable analytics. Supports export to CSV/PDF, scheduled reports, and integrations with tools like Google Analytics or Amplitude.
Join for Early Access
⚡ Limited offer — only before public launch.
Get pre-launch access to the AI Product Manager Assistant and save:
 $153
($180)
$153
($180)
 $204
($240)
$204
($240)
 $187
($220)
$187
($220)
 $136
($160)
$136
($160)
 $204
($240)
$204
($240)
Clients value this module for turning raw data into clear, actionable insights. They frequently highlight how the interactive dashboards, dynamic filters, and visual charts help them track performance, identify trends, and make faster decisions. The ability to export reports and customize views based on roles or KPIs makes it a favorite among managers and product teams. Many noted that the module significantly improved transparency across teams and saved time on manual reporting. Its smooth integration with internal APIs and external analytics tools is another major advantage, especially for growing platforms.