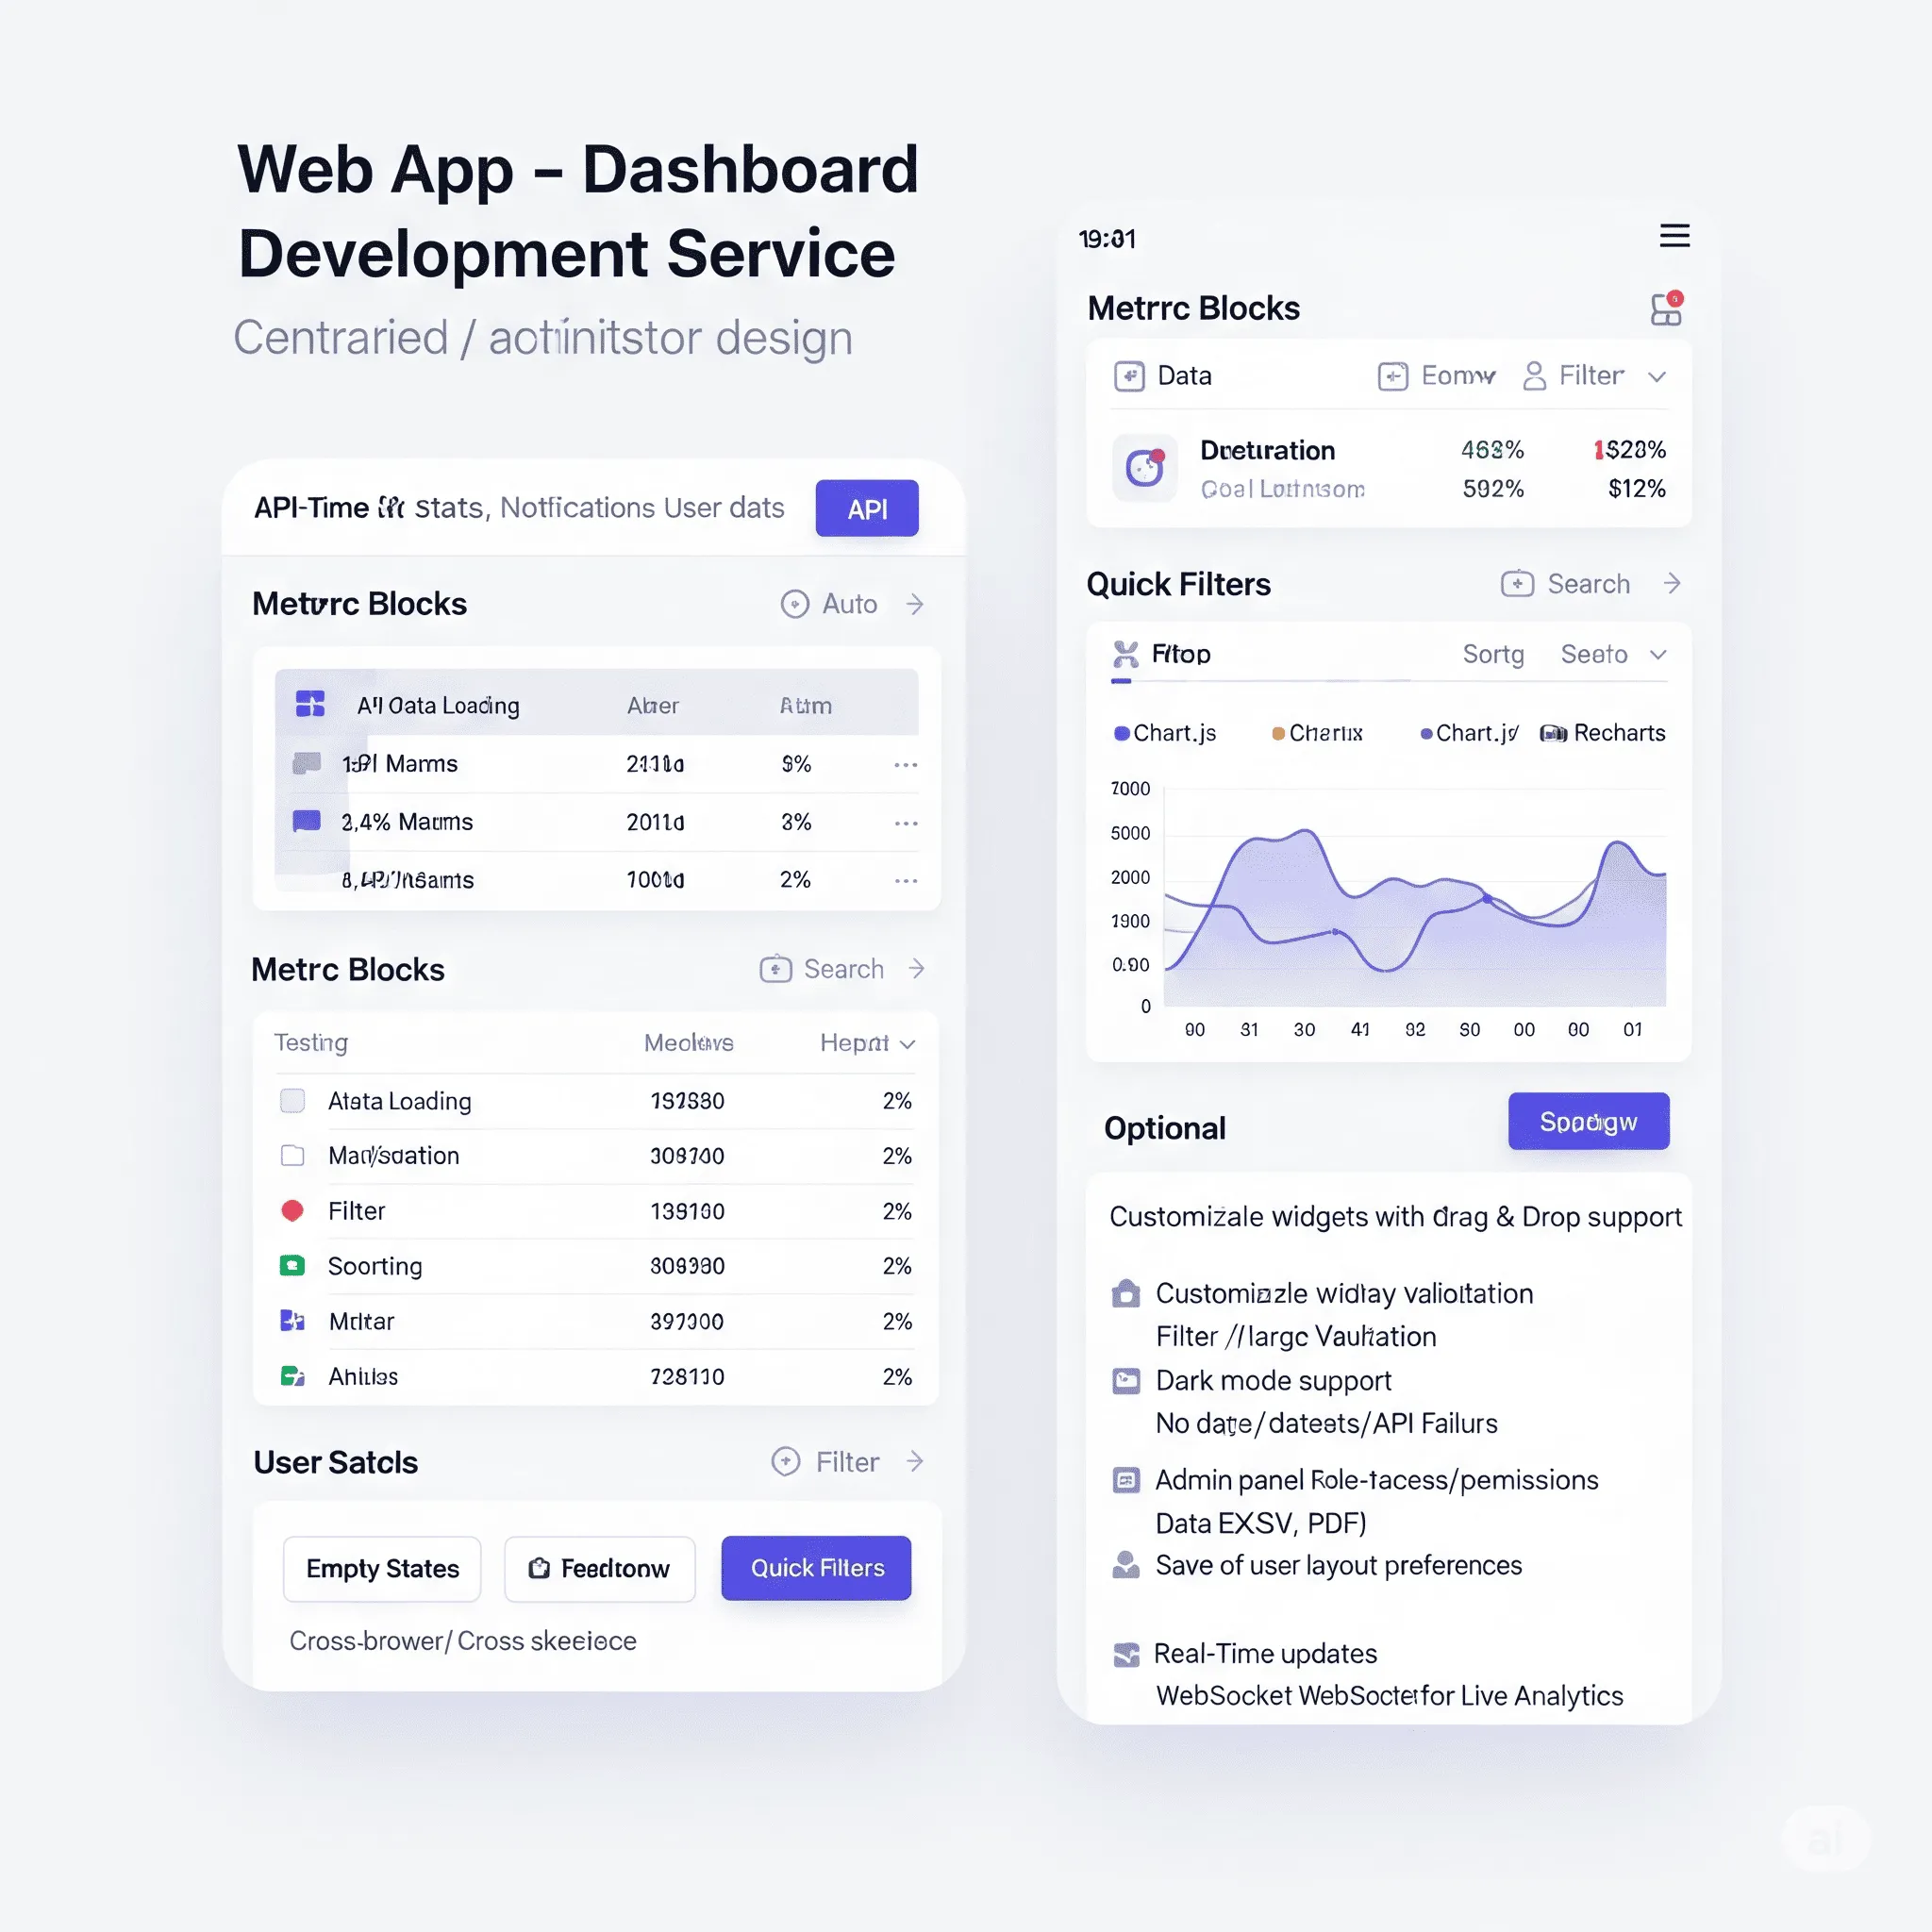
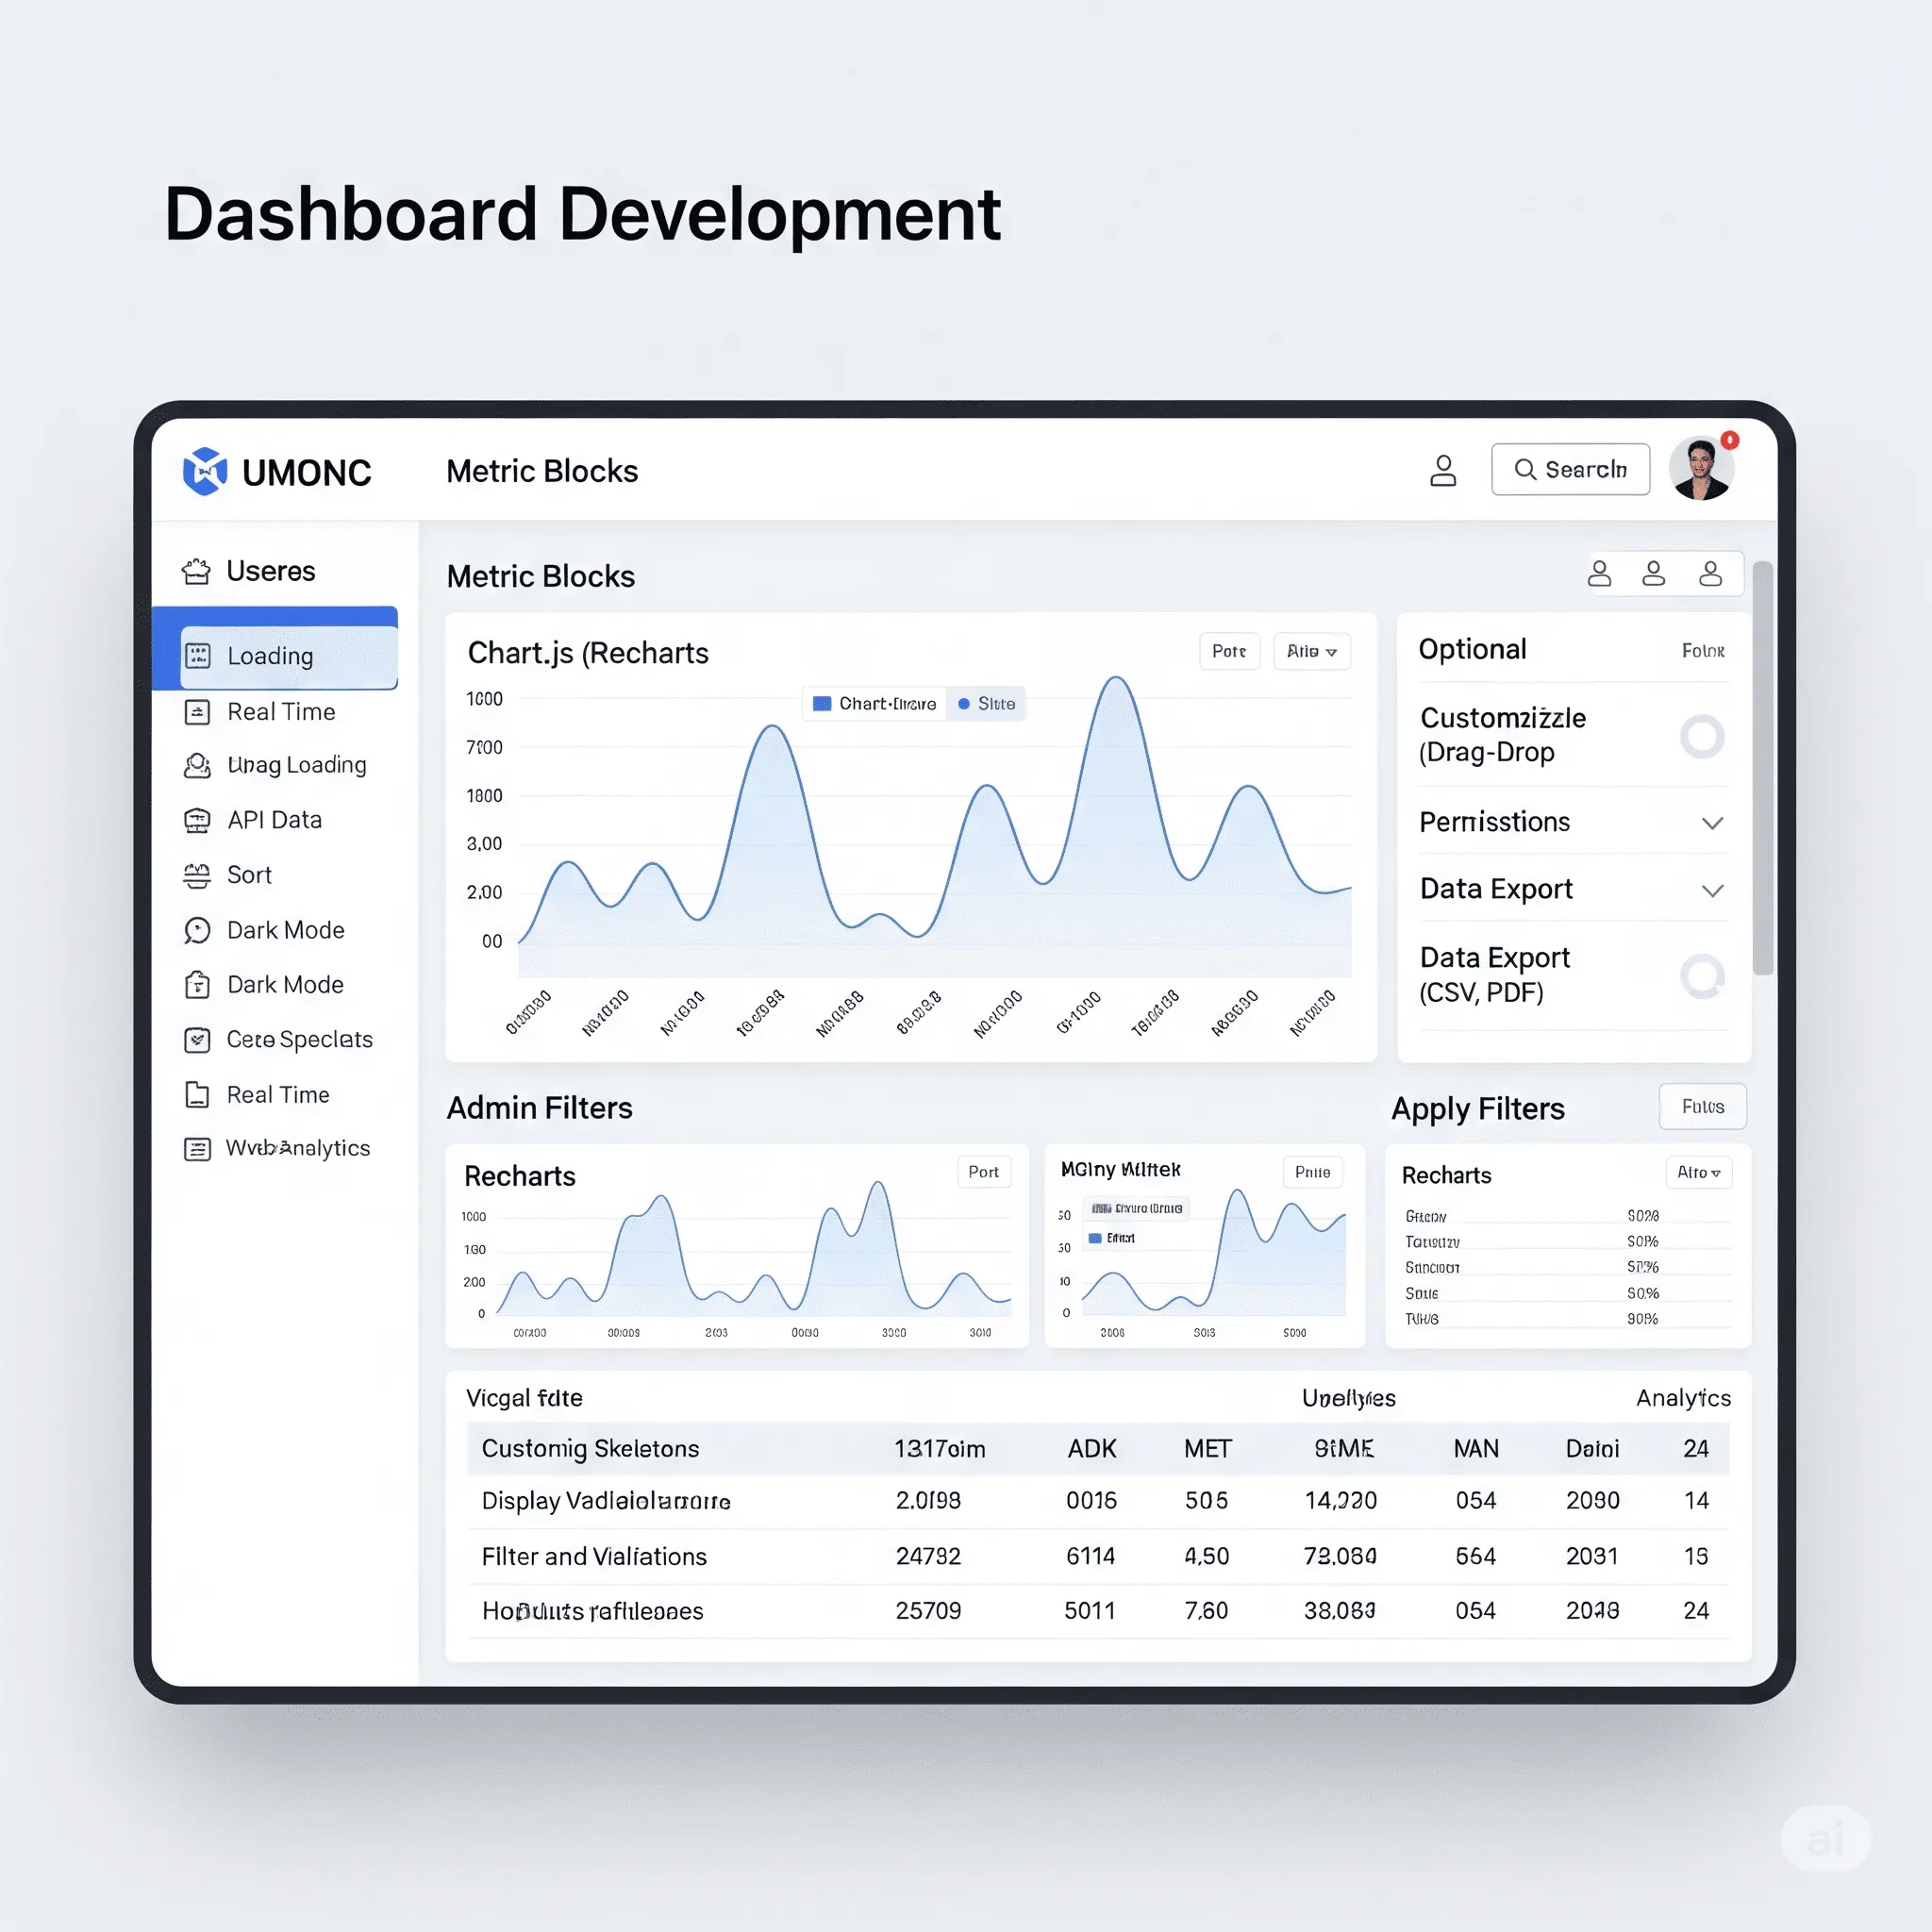
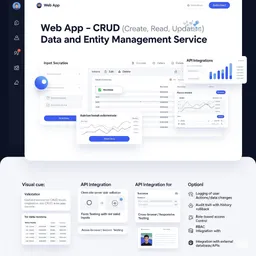
Feature goal: Build a centralized interface where users or administrators can view and interact with key data in a clear, dynamic, and actionable way.
🎉 Price from: $204 ($240)
You save: $36 (15%)
Rates: Junior $8–$12/h | Middle $20–$25/h | Senior $30–$40/h
Timeline: 3-5 days
You select the Dashboard module, register, and describe what metrics, tables, and filters you need. The system matches you with a certified developer who builds and integrates a custom dashboard into your app or admin panel.
Certified freelancers (Junior, Middle, or Senior levels) handle the development. You choose the skill level depending on your budget, deadlines, and dashboard complexity.
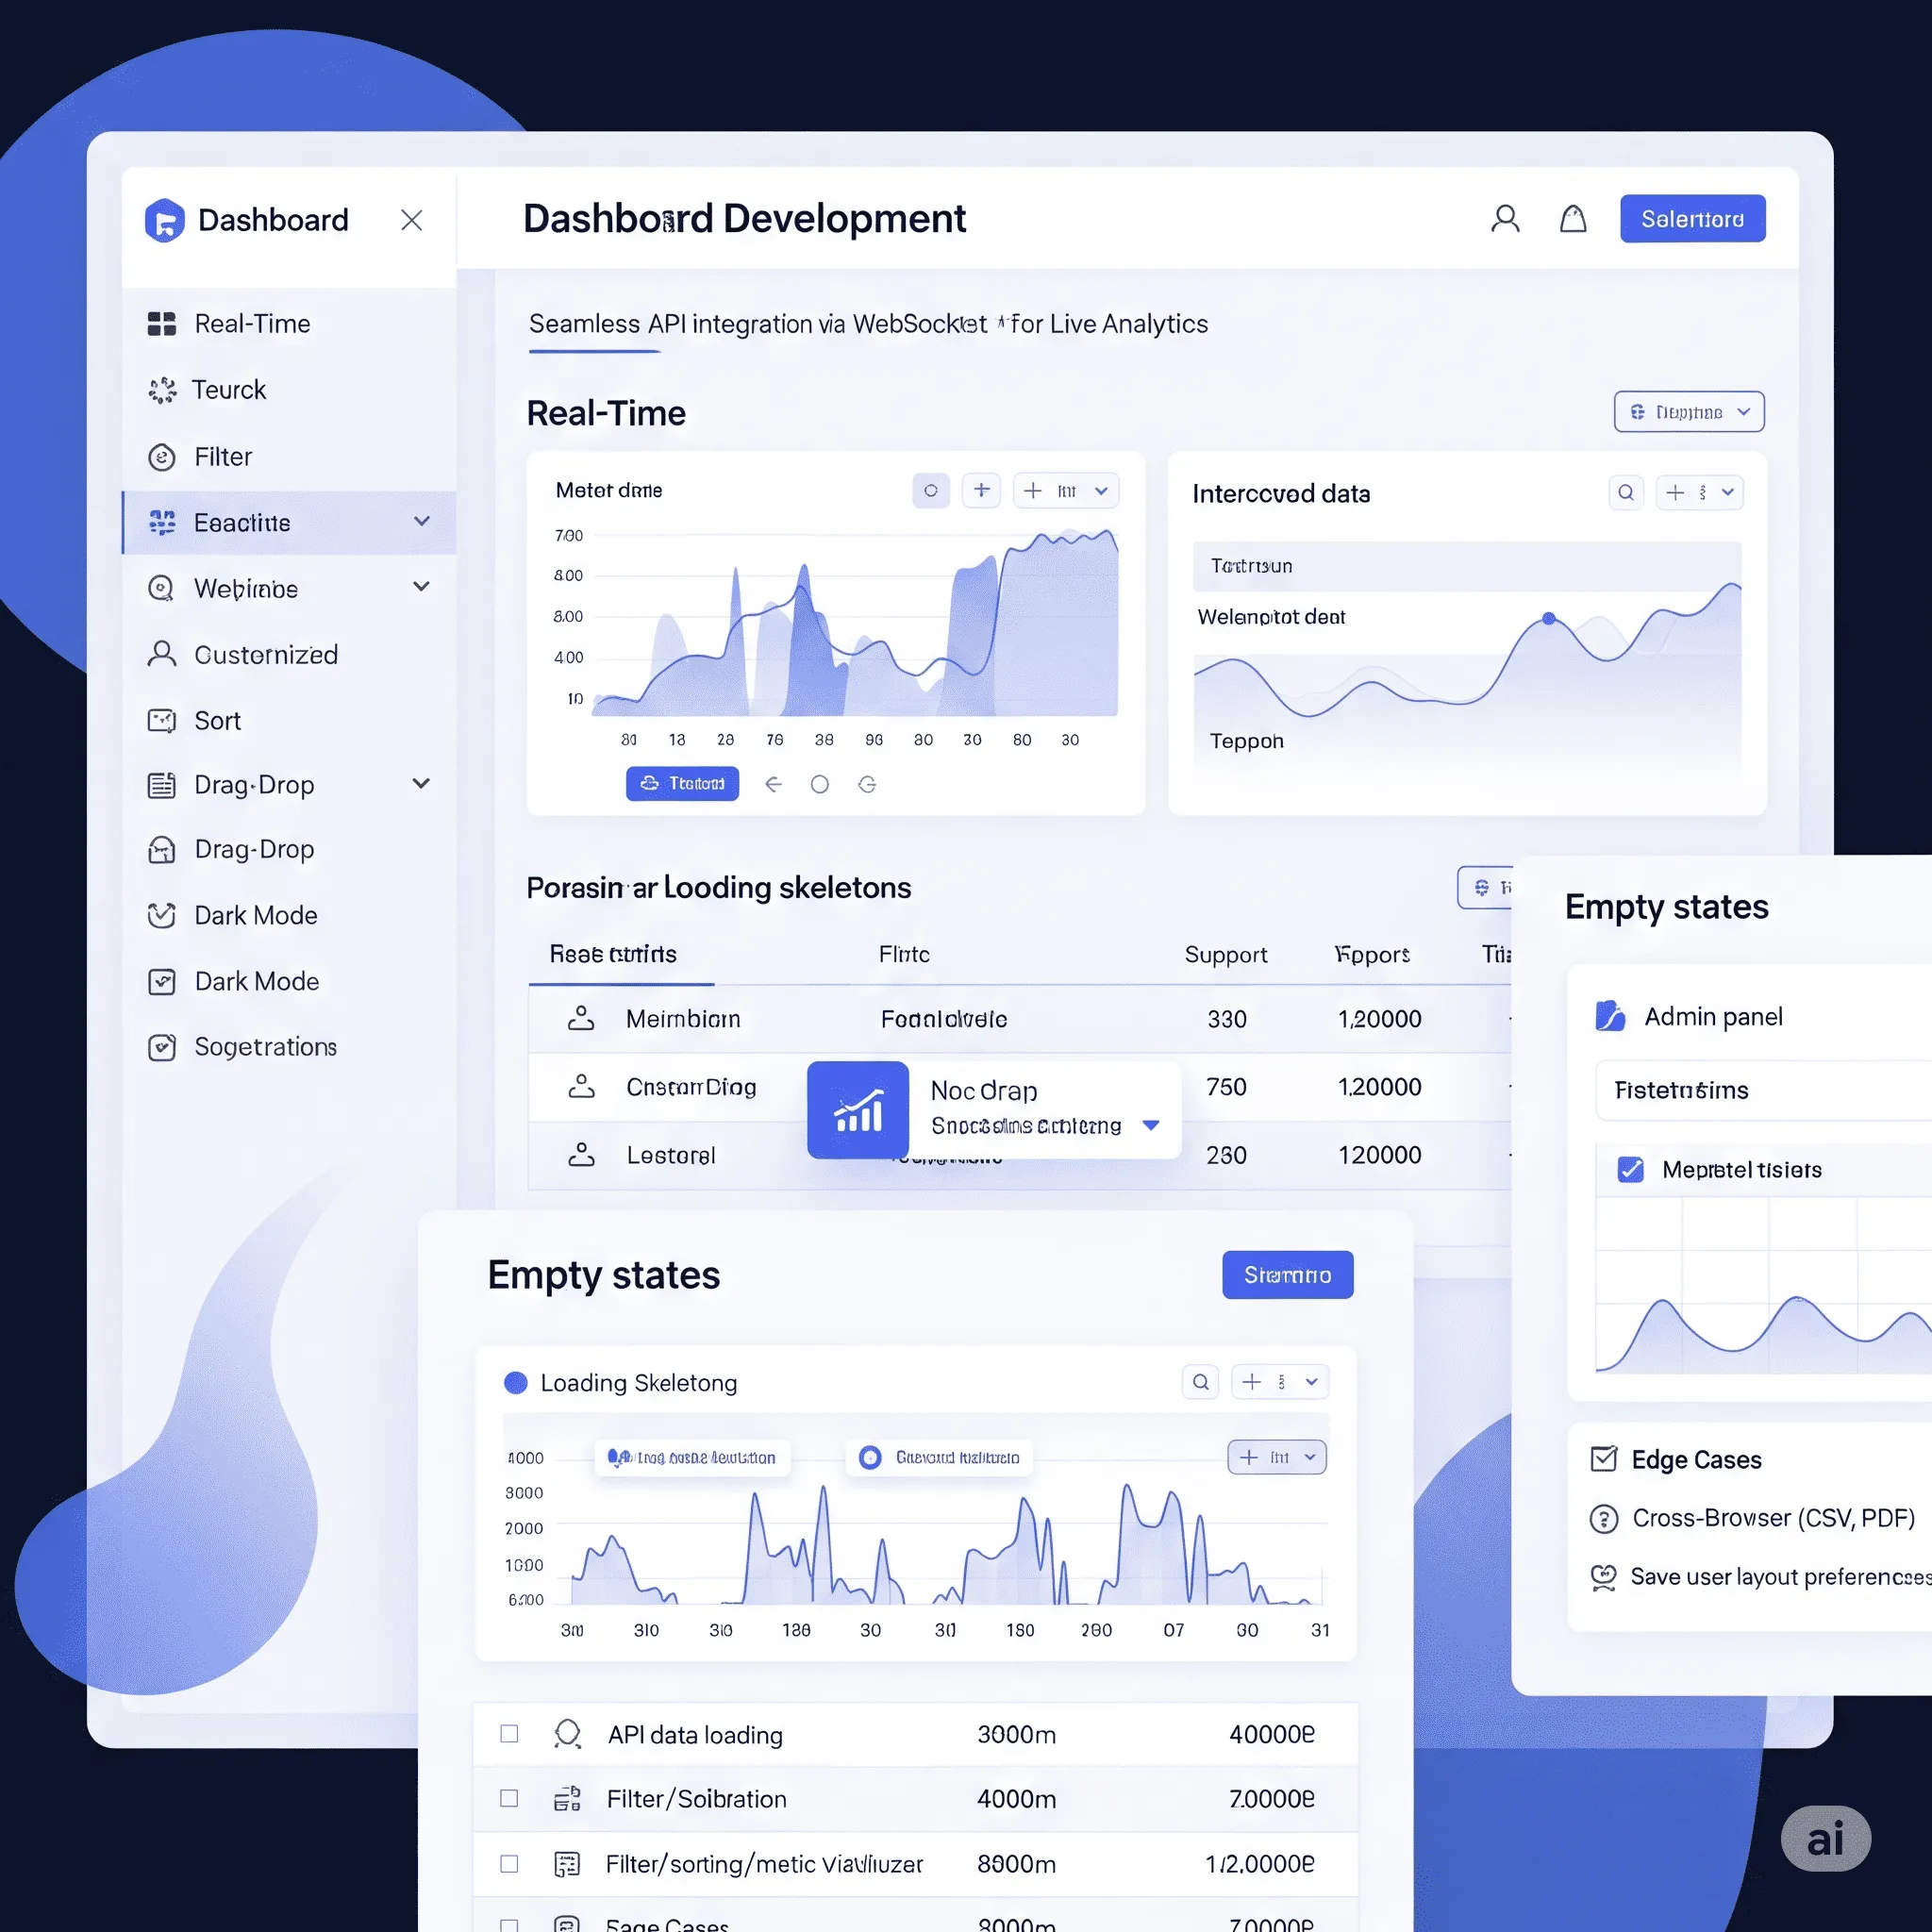
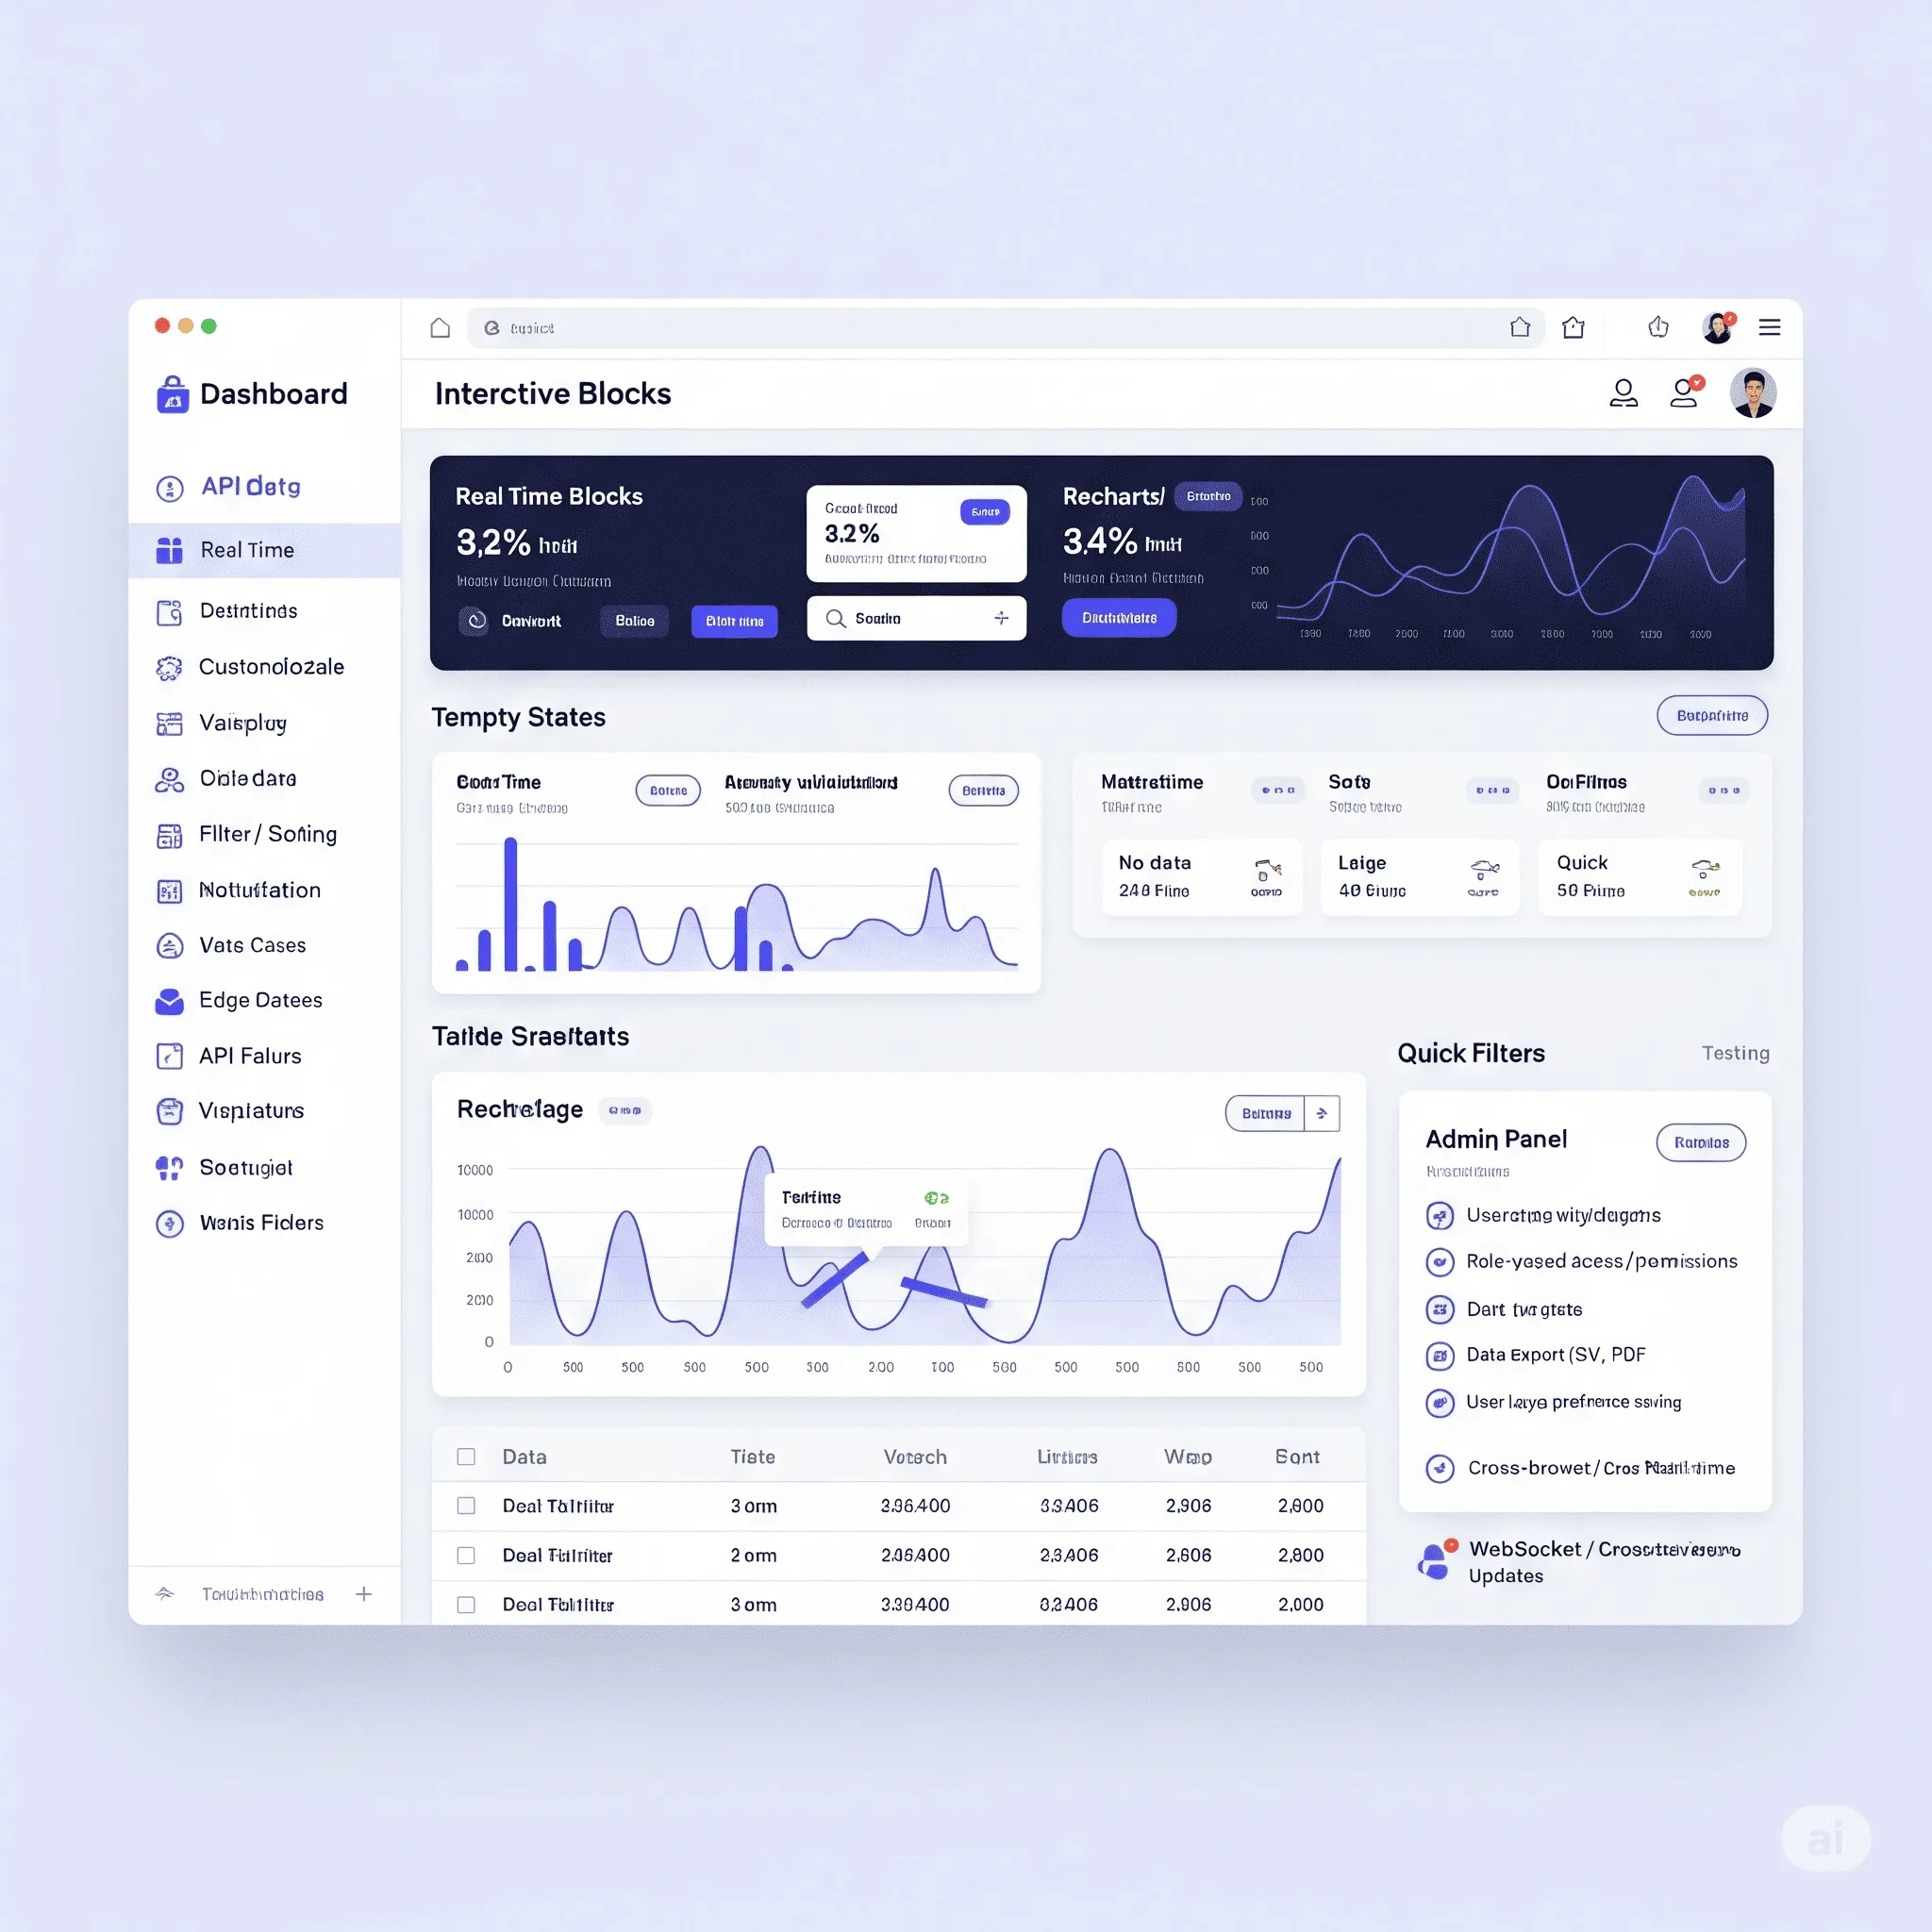
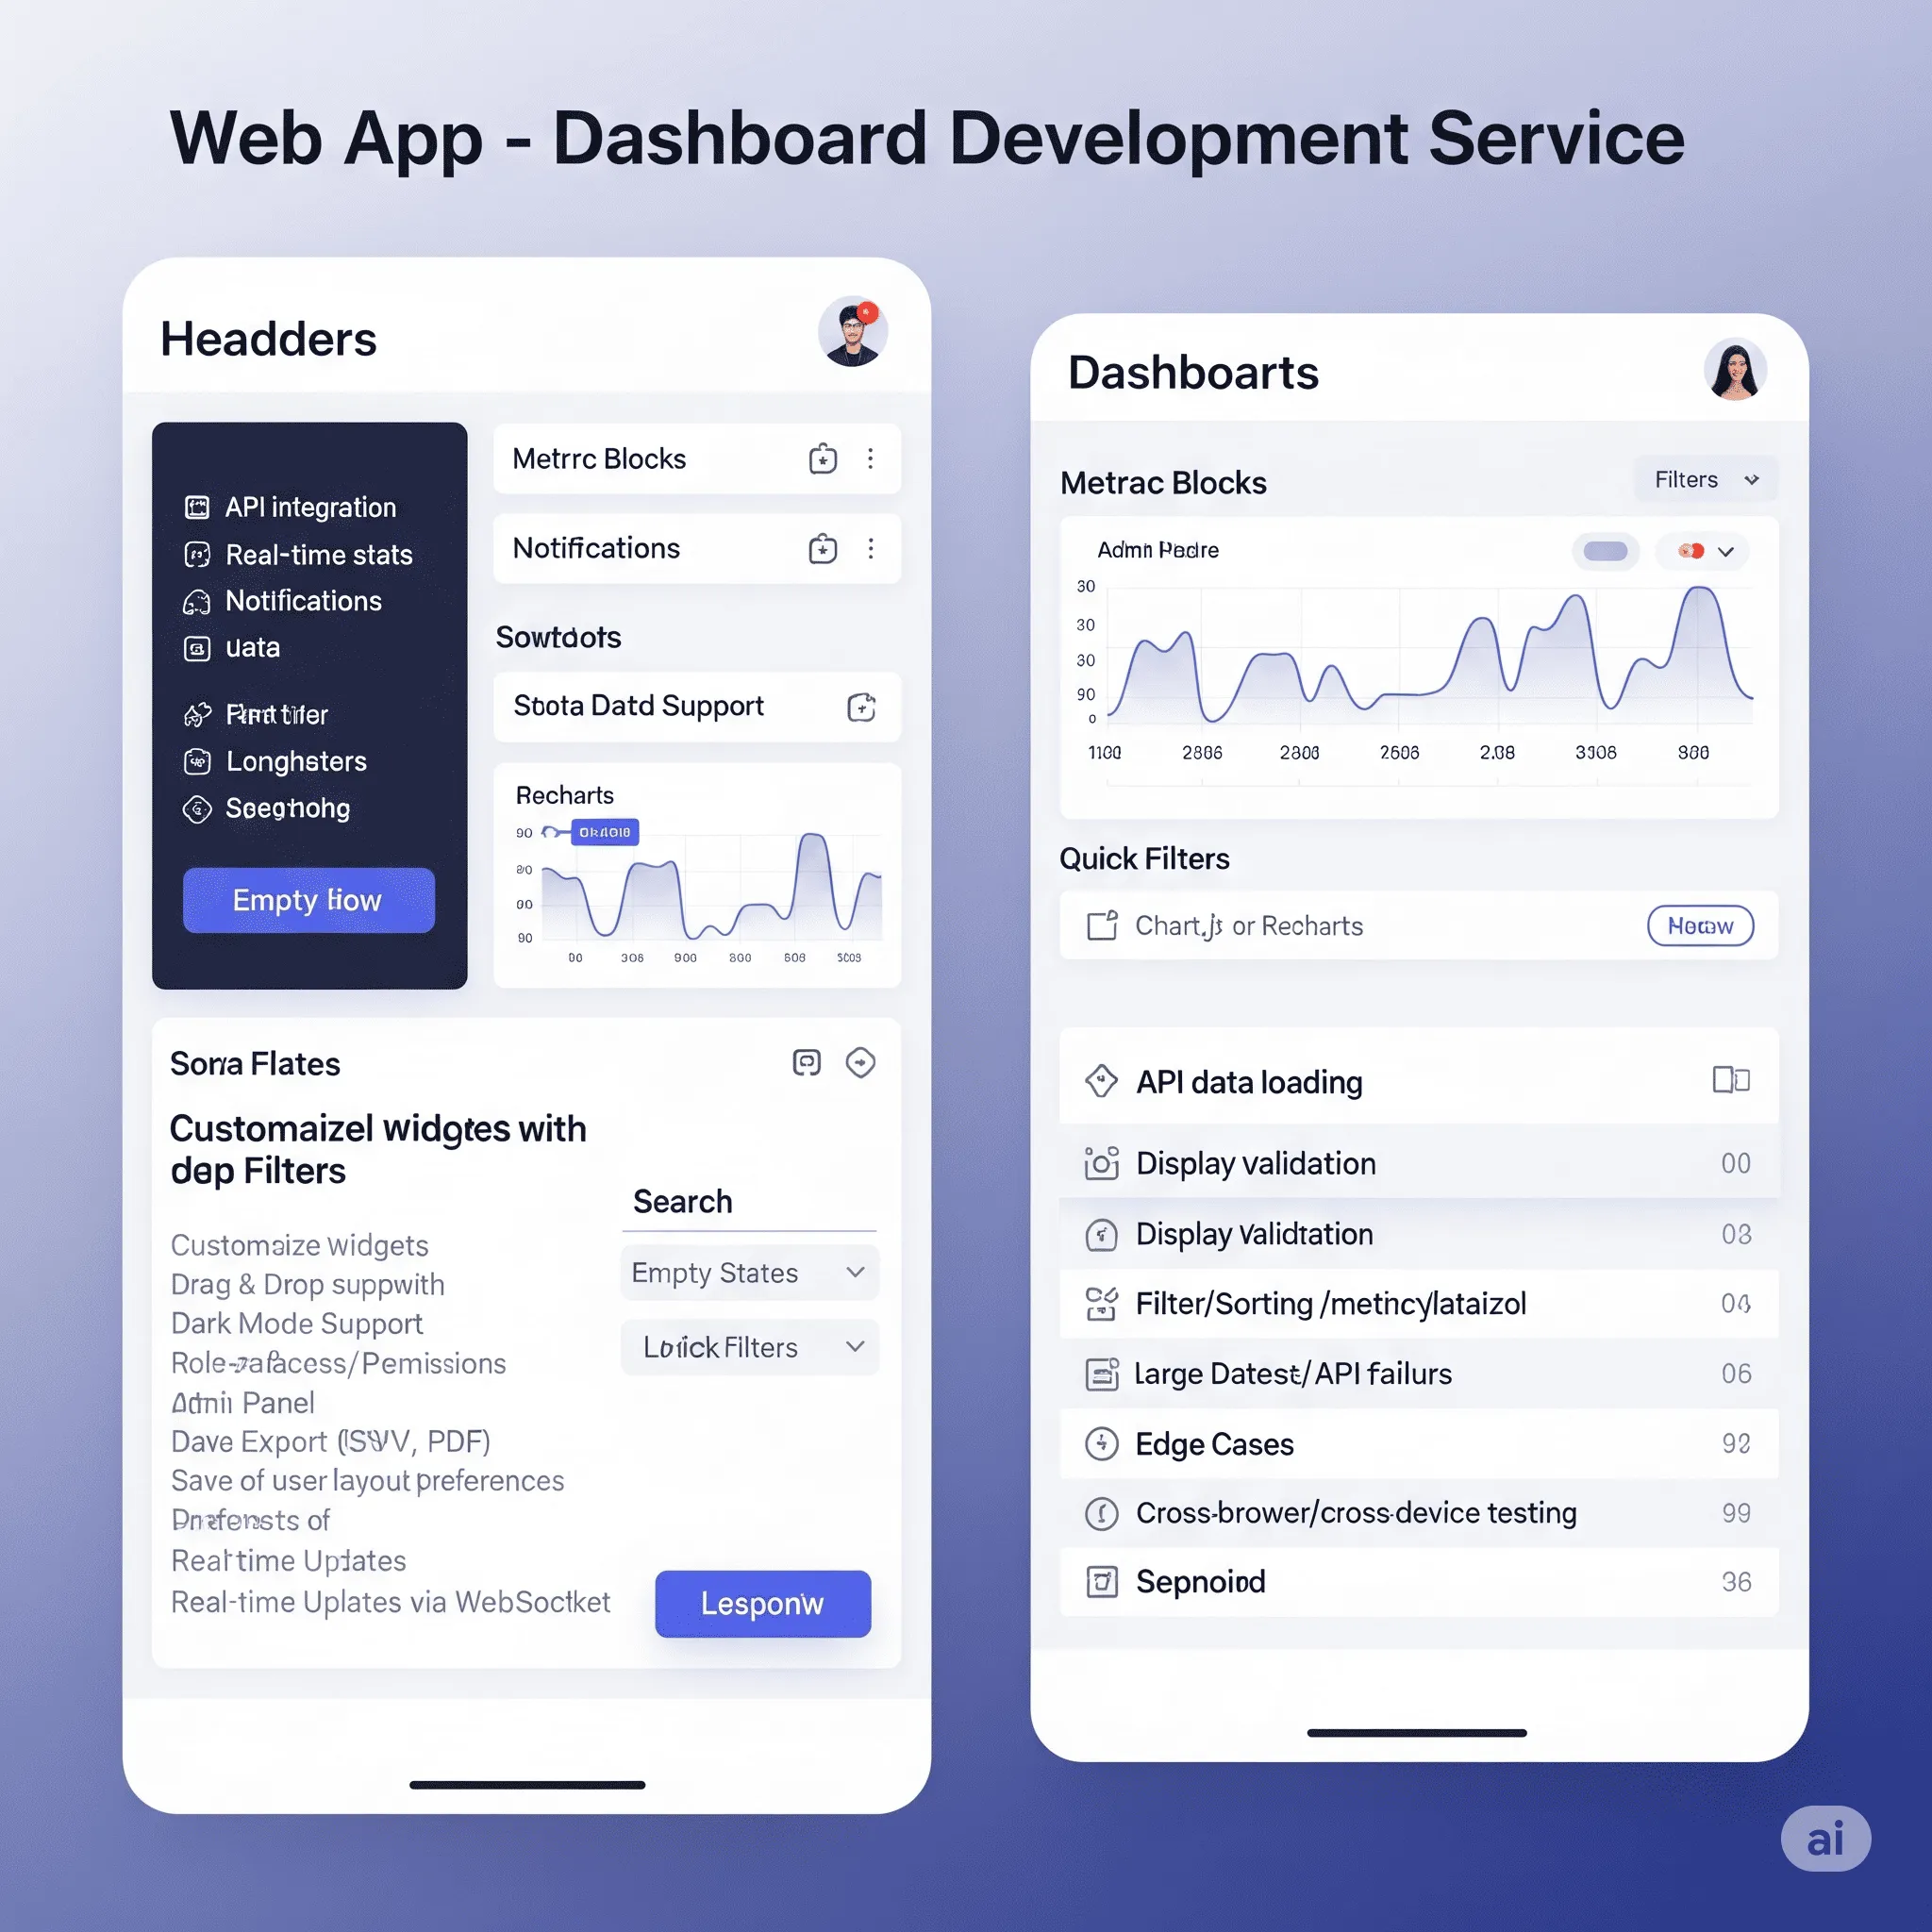
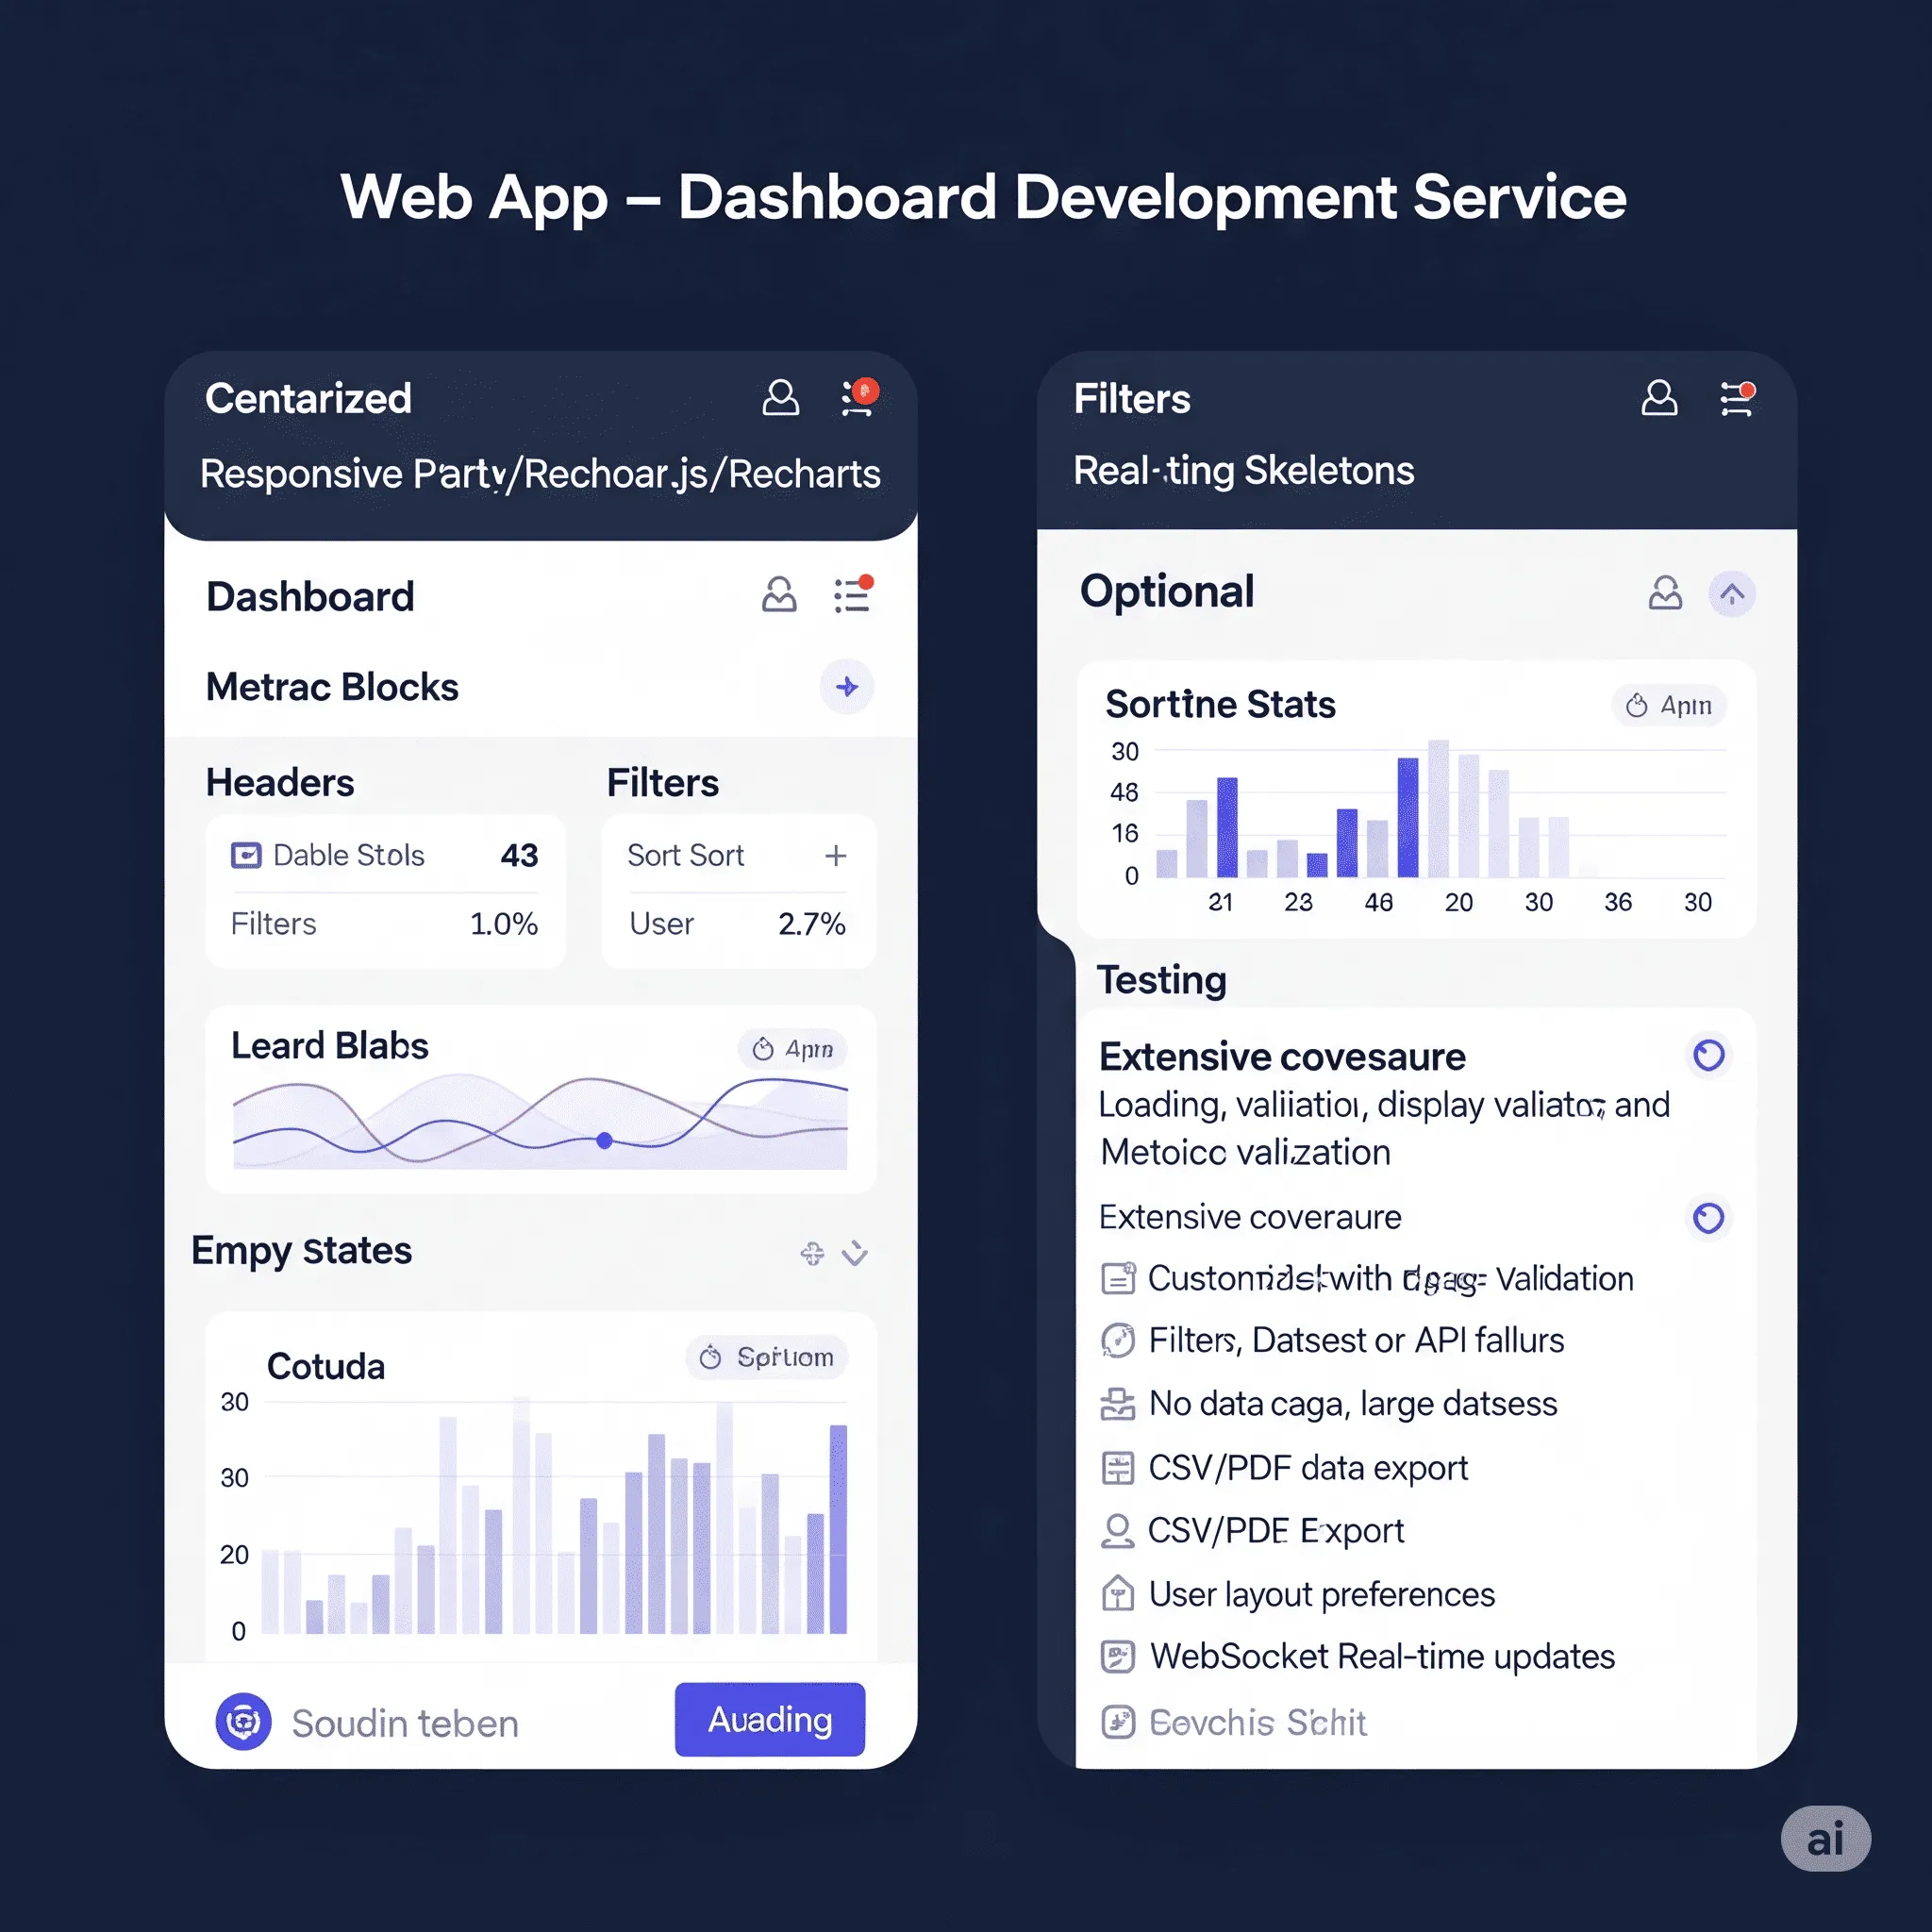
A fully functional, responsive dashboard with metrics blocks, filters, charts and tables - integrated with your API or backend. The dashboard will be user-friendly and designed for both mobile and desktop.
Sure. You can define what data will be displayed, how it will be grouped, what filters are needed and whether you need additional features such as dark mode, drag-and-drop widgets or export options. The developer will design or customize the customization according to your needs or the layouts and/or designs you provide.
No worries - our AI Product Manager Assistant can guide you through common use cases, best practices, and help shape a developer-ready spec based on your business goals and platform type.
Ideal for SaaS platforms, admin panels, analytics tools, and B2B services that require clear data visualization and user control. This module includes metric blocks, tables, filters, and charts - everything needed to track performance and support decision-making. API-ready, mobile-friendly, and optimized for real-time updates and scaling. Common clients: founders, analysts, product teams, and businesses building internal tools or client-facing dashboards. Customizable widgets, role-based access, and export features available.
Join for Early Access
⚡ Limited offer — only before public launch.
Get pre-launch access to the AI Product Manager Assistant and save:
 $153
($180)
$153
($180)
 $204
($240)
$204
($240)
 $187
($220)
$187
($220)
 $136
($160)
$136
($160)
 $204
($240)
$204
($240)
Clients describe this module as an essential tool for bringing clarity and structure to their data. They appreciate the clean layout, customizable widgets, and the ability to visualize key metrics at a glance. The combination of real-time updates, interactive filters, and export-ready tables helps teams make faster, data-driven decisions. Many highlight how the responsive design and dark mode improve usability across devices and working environments. Several clients reported that the dashboard instantly improved internal workflows and gave stakeholders better visibility into performance. They also value how easily it connects to their existing APIs and backend systems.